How to create a statistic chart?
This article shows how to display the search results as a Chart. You can view the results in a variety of formats: line, area and bar charts. Also, it is possible to save the Chart on your Dashboard, it's described below.
Learn about charts
Statistic Charts are useful for monitoring any process with a level of variation – for example, Billed Time, Cost, Rates and others. They can easily illustrate the data for analyzing and improving efficiency.
Moreover, the User can create Charts in the Summary Report, Orig-Term Report and Active Calls sections and export a respective Chart to the Dashboard section.
A Chart has several elements. Some of these elements are displayed by default, others can be added as needed. The user can change the display of the chart elements and remove elements that he does not want to display. Also, it is possible to create a Combination Chart by using more than one type.
The elements of a chart
- Title - a default name of a target Chart that can be edited by a user.
- Chart area defines the boundary of all the elements related to the chart including the plot and any headings, legend, tooltips.
- Plot area contains all chart statistics data and bounded by the X and Y Axes.
- X Axis (horizontal) and Y Axis (vertical) that define the base and the left side of the Plot area.
- Data points are actual data of a target Chart.
- When hovered over a data point of a Chart, a tooltip containing a detailed description of a respective data point(s) will be displayed.
- Zooming tool provides additional type of the Chart overview.
- Chart settings where user can set chart type, change chart name, set values for both axes, update chart, etc.
- Legend of the chart that provides explanation for chart data points.
- Toolbar allows general management of a chart: make a copy of target chart, export one or close it.
Roll the mouse wheel chart to zoom in/out on the chart. Also, drag the chart area to arrange a showing region.
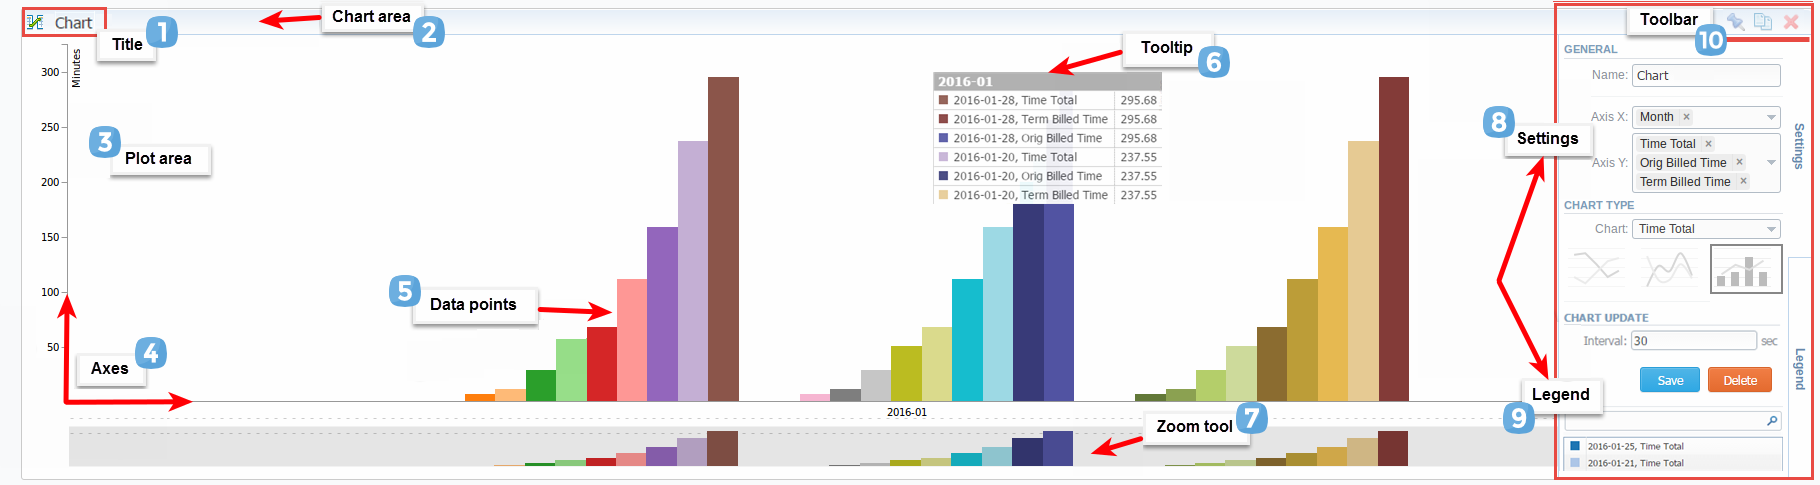
Chart toolbar
To show a customized toolbar, point to the upper-right corner of the chart area and additional options become visible.
Quick Access Tools:
- To export a chart to the Dashboard, click on the Add chart icon.
- Here you can make a copy of a chart by clicking on the Copy icon.
- To close the chart, click the Close icon.
Therefore, you can use the default templates, copy and customize them according to your demands.
To choose the default template, click the Show Chart button and select it from the drop-down list.
Chart settings
-
General information block:
- Name - enter a unique heading.
- X Axis - choose values for the line on a chart that runs horizontally. You can choose several parameters; if the needed values are not available, check the parameters specified in the Group By field and run the report again.
- Y Axis - specify parameters for the line that runs vertically. You can create only two axes with limited units of measure (money/time/%). For example, you can choose cost total, average rate, time billed — but not ASR Std (%) on the same chart.
-
Chart Type
This form describes the variety of types available for usage:
-
 Bar Charts display the data arranged and plotted on a standard column chart. The vertical columns with distinct colors rise from the horizontal axis to visually represent the desired data. This type is mainly effective while comparing a large quantity of data points over several axes.
 -
 Area Charts show meaningful information and fill the area between the line and the threshold with different colors. This type is almost the same that a line chart but the area below the plot line is solid. It is primarily used to show data over time or other categories.
 -
 Line Charts use one or several horizontal lines to visually depict data points. This type is useful to display the data points over time. It's helpful for Active Calls statistic charts.
Stacked Charts - Use these charts to display cumulative series of values and emphasize the total:
-
 Stacked Bar charts display the data arranged and plotted on a standard column chart.
 -
 Stacked Area charts show meaningful information and fill the area between the line and the threshold with different colors.
 -
 Stacked Line charts use one or several horizontal lines to visually depict data points.
Also, you can create a multi-format chart. So, you can select/change the visual representation of each parameter from the Y Axis.
-
-
Chart Update
This information block contains:
- Interval field where you can specify the update period in seconds for the chart (e.g., 30 sec).
- Show last field that defines the period for which chart data is displayed (e.g., last 60 min).
Click the Save button on the toolbar to save changes.
Click the Delete button on the toolbar to remove the chart.
Legend
This form enables to navigate between the data points in the chart and modify chart Legend entries. By default, it indicates the colors of the plotted data and corresponding parameters.
-
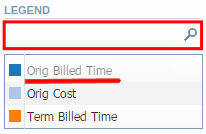
To promptly find respective Legend entries use the Quick Search tool.
-
To disable the visibility of the parameter on the chart, click on the respective value, for example, Orig Billed Time (highlighted in the screenshot below) and it becomes gray. Also, you can change the colors of the chart Legend entries by clicking on the item color.
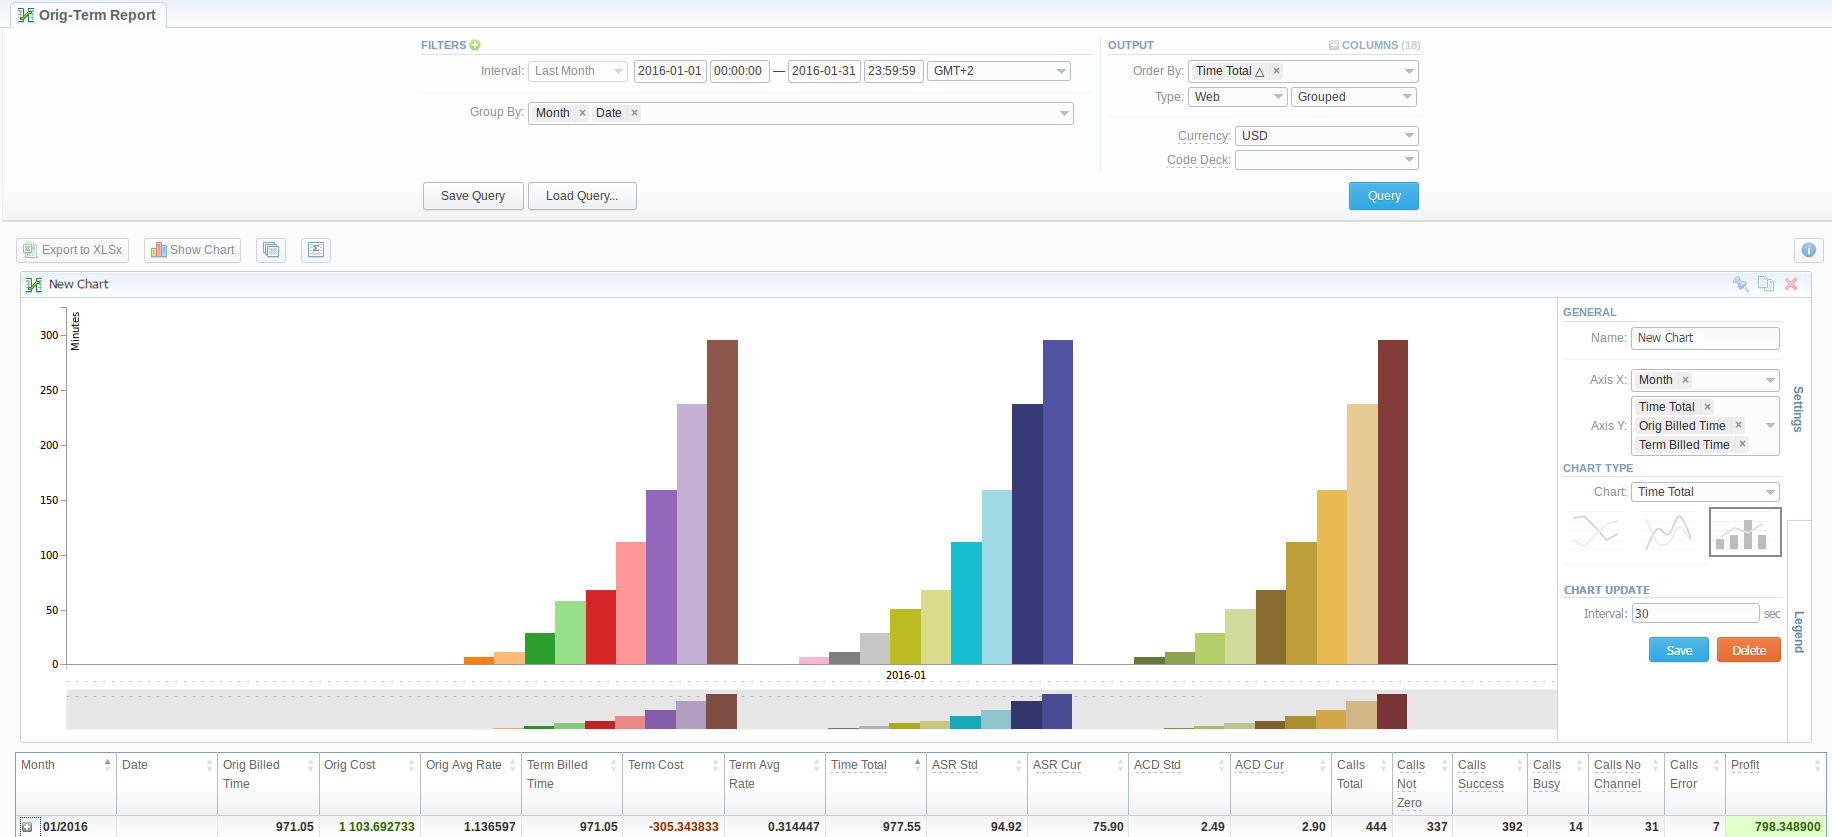
Creating a basic chart
In order to create a basic visual chart, you need to generate the report. You can do this in the Summary Report, Orig-Term Report or Active Calls sections. The chart only can be made on the basis of the generated report. There are several steps for creating a simple chart:
- Click the Show Chart button on the toolbar.
- Choose the Blank Chart from the drop-down list.
- Open the Settings on the right toolbar.
- Specify the Name, and choose parameters for X Axis and Y Axis.
- Then, choose the Chart Type. It could be a multi-format chart.
- If applicable, you can save the template of the chart by clicking on the Save button.
If you want to properly create a Line chart for different clients, please follow these steps:
- Choose the Orig Client parameter in the "Group By" field;
- Click the Show Chart button and open the chart settings;
- Select Date and Time parameters on X Axis, Calls Total parameter on Y Axis;
- Then specify a line type of the chart and press the Save button.
The chart displays only an active statistics presented in the report. You can check an actual date interval by clicking the Info icon and it can differ from the specified interval if there is no date for the period.
When you choose the Time parameters on the X Axis (e.g., Year, Month, Date, Time) and there is only one period, the line chart will not display the data. For example, if you choose the Month on X Axis and the statistics is only presented for January, the line chart will be empty in this case.
Displaying a chart on the Dashboard
You can export already created chart to the Dashboard by clicking the Add Chart icon on the toolbar in the report. Then, this chart appears on the Dashboard.
Alternately, you can go to the Statistics → Dashboard. Then, follow these steps:
- Choose a target Dashboard from the list of all existing ones (for example Orig-Term, Default).
- Click the Show Chart button and select the respective chart from the drop-down list.
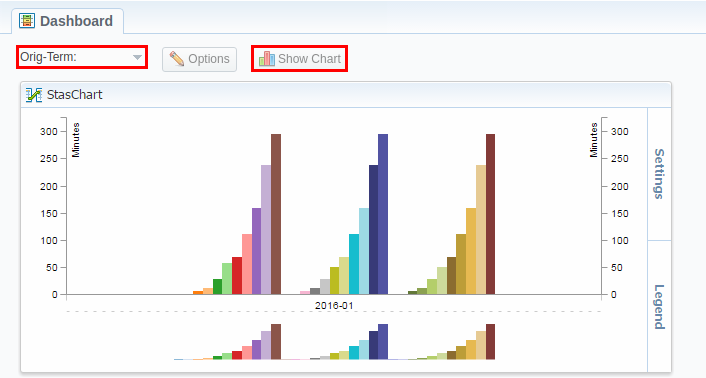
Chart templates usage
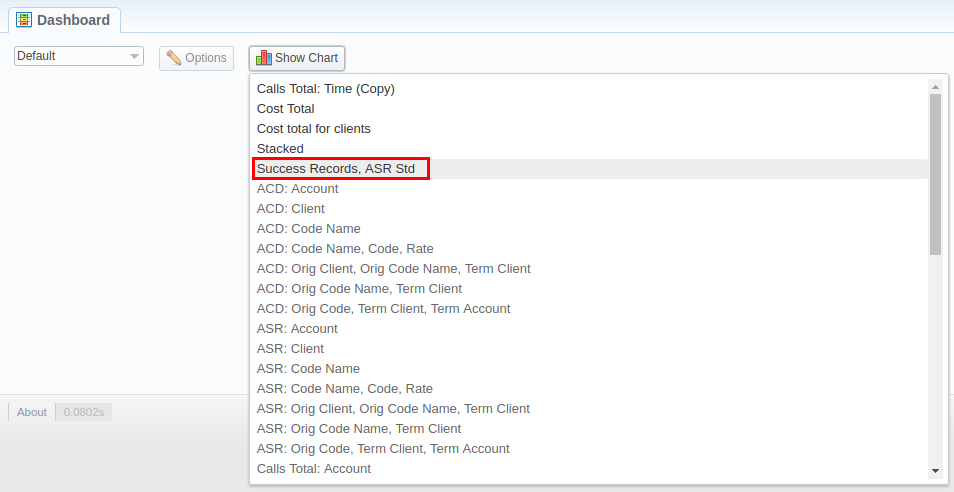
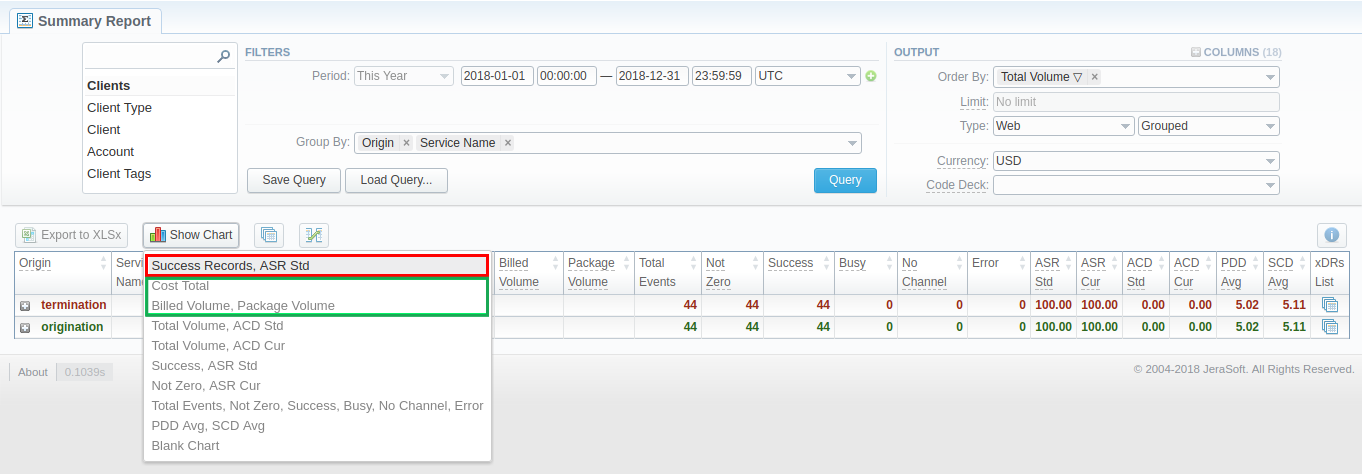
A Chart Template is a set of pre-configured charts saved in the Dashboard (highlighted with red) and auto-generated templates for each report (highlighted with green) that depend on the suggested combination of parameters and present statistics for the report (see screenshots below):
Please note, the default interval for chart templates is 7 days. Only Profit - Yesterday by Hours and Calls Total - Origination by Last Week have another default interval.
-
The pre-configured chart templates (e.g., Success Records, ASR Std) saved in the Dashboard are available in the Summary Report section due to selected "Group By" parameters (e.g. Service Name) while you generate a report. Respective templates will be visible in the drop-down list of the Summary Report section only if you save it and export to the Dashboard previously.
-
The auto-generated templates for each report (e.g., Cost Total) are accessible in the Summary Report section due to selected "Group By" parameters, Columns values and active statistics in the report. To use a respective template, select it from the drop-down list and customize it according to your demands. The names of these templates represent predefined parameters on Y Axis.
-
If any Time parameters (e.g., Year, Month, Date, Time) is selected in the "Group By" field, all other values will be skipped for auto-generated chart templates on X Axis.
Please note, the resellers and administrators have their own dashboards. The created dashboards while logged in the system as respective reseller will be visible only for this reseller.