Customer Dynamics
Section overview
The Customer Dynamics section is designed to illustrate the customers' data for further analysis. Here, the report data is presented in the form of a table. However, you can create a chart to interpret key information more effectively.
Creating a new report
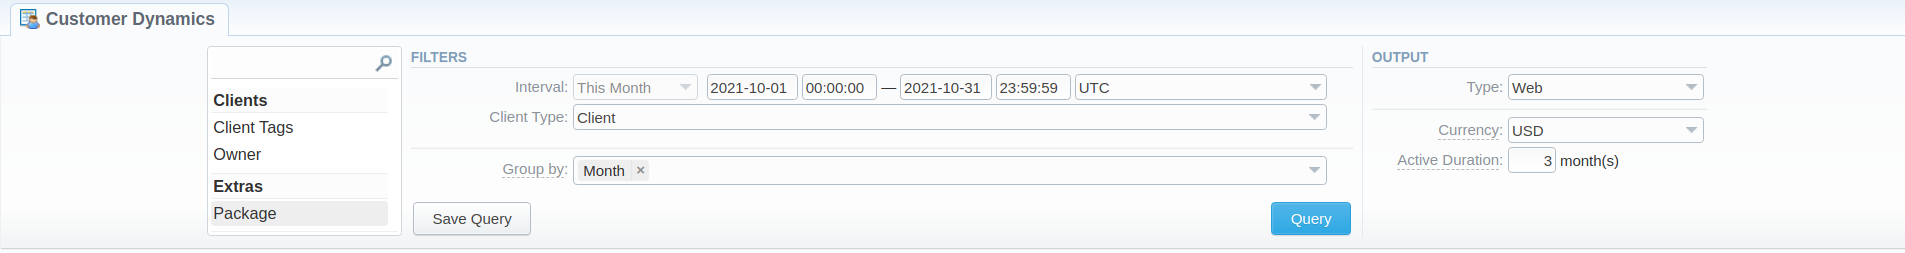
To generate a report, you need to fill in the form and click the "Query" button. The query form consists of the following parameters:
Filters
On the Filters menu, select the required parameters for the report. To cancel any filter, click on the delete icon next to the filter. You can start a quick search by typing filters' names in the field at the top of a drop-down menu with filters.
| Field | Description |
|---|---|
| Interval | Specify the time interval for the report and a timezone. Please note that the Interval field is mandatory. |
| Client Type | Select a client type from a drop-down list: - Client - Reseller - Calling Card - Call Shop |
Additional filters
The following additional filters are available: By clients: Client Tags, Company, Owner User. Extras: Package.
| Field | Description |
|---|---|
| Client Tags | Specify certain tags to filter clients and show more detailed results in the report |
| Company | Define a reseller for the report |
| Owner User | Define a user for the report |
| Package | Enter a package for the report |
Group by
The following options to group the data in reports are available:
- Time: Year, Month, Date.
- Extras: Package Name.
Output
This section contains settings for the output data of the report:
| Field | Description |
|---|---|
| Type | Choose a format of the report from a drop-down list: Web/CSV/Excel XLS/Excel XLSx |
| Send to | You can send generated reports via email. Also, it is possible to specify several emails. Available only for CSV/Excel XLS/Excel XLSx formats; it doesn't work with Web. |
| Currency | Specify a currency for the report. All values will be automatically converted to the specified currency in the report. |
| Active Duration | Determine the period (in months). If the customer has used any paid services within this period, they will be considered an active client. |
A generated Customer Dynamics report is demonstrated on a screenshot below:
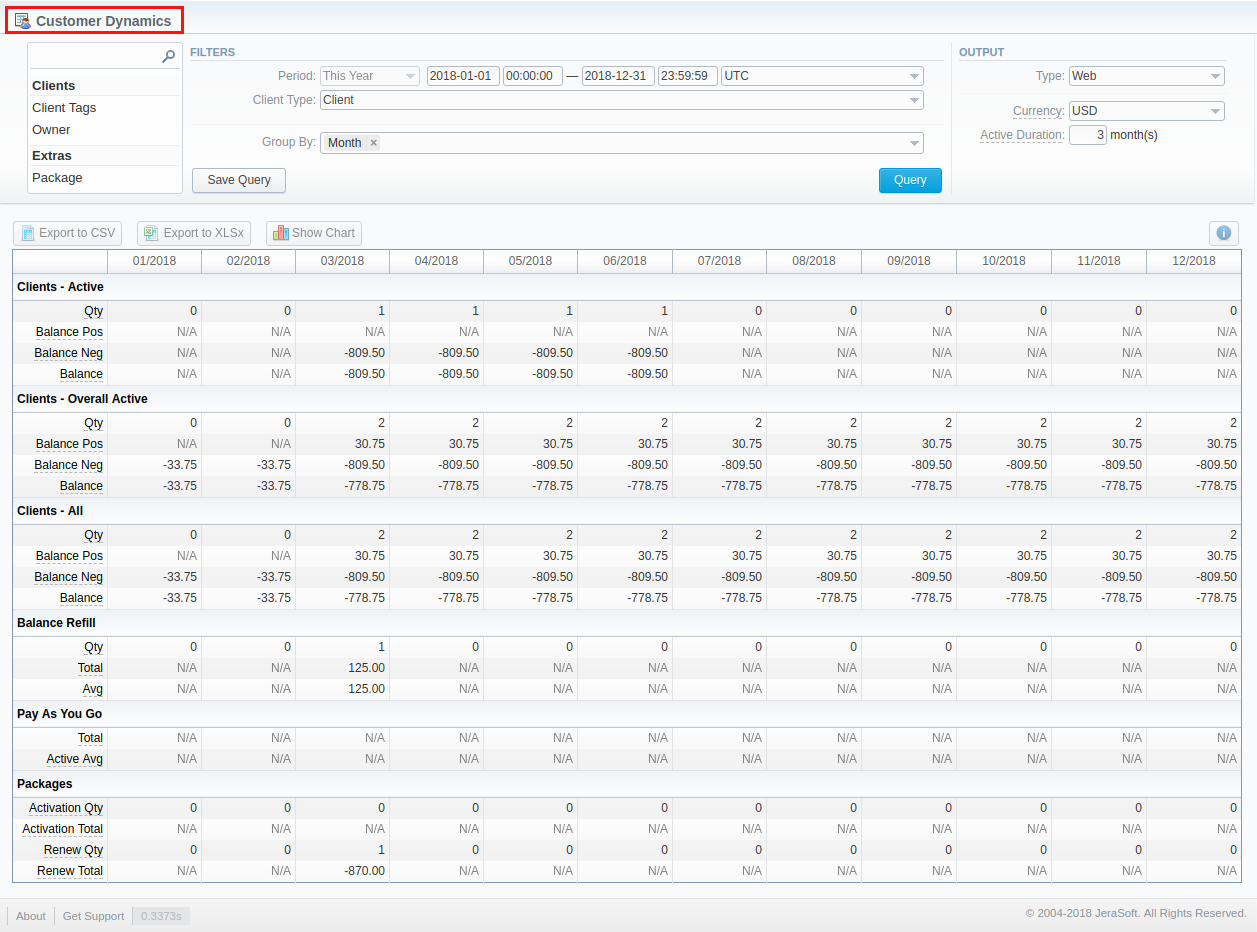
| Section | Column | Description |
|---|---|---|
| Clients - Active | Qty | Overall number of clients that used any paid services within the last Active Duration period. |
| Balance Pos | Total of all positive balances for the clients that used any paid services within the last Active Duration period. | |
| Balance Neg | Total of all negative balances for the clients that used any paid services within the last Active Duration period. | |
| Balance | Total of all balances for the clients that used any paid services within the last Active Duration period. | |
| Clients - Overall Active | Qty | Total quantity of clients that used any paid services at any time. |
| Balance Pos | Total of all positive balances for the clients that used any paid services at any time. | |
| Balance Neg | Total of all negative balances for the clients that used any paid services at any time. | |
| Balance | Total of all balances for the clients that used any paid services at any time. | |
| Clients - All | Qty | Total quantity of clients according to current filters. |
| Balance Pos | Total of all positive balances for the clients according to current filters. | |
| Balance Neg | Total of all negative balances for the clients according to current filters. | |
| Balance | Total of all balances for the clients according to current filters. | |
| Balance Refill | Qty | Number of balance refills during the specified period. |
| Total | Total amount of balance refills during the specified period. | |
| Avg | Average amount of each refill during the specified period. | |
| Pay As You Go | Total | Total amount spent on any services out of package subscription plans. |
| Active Avg | Average amount of Pay as you Go services usage per currently active customers. | |
| Packages | Activation Qty | Number of packages activations during the specified period. |
| Activation Total | Total amount charged for all activations of the packages. | |
| Renew Qty | Number of packages renewals during the specified period, including initial renew within the activation of the package. | |
| Renew Total | Total amount charged for packages renewals, during the specified period, including initial renew within the activation of the package. |
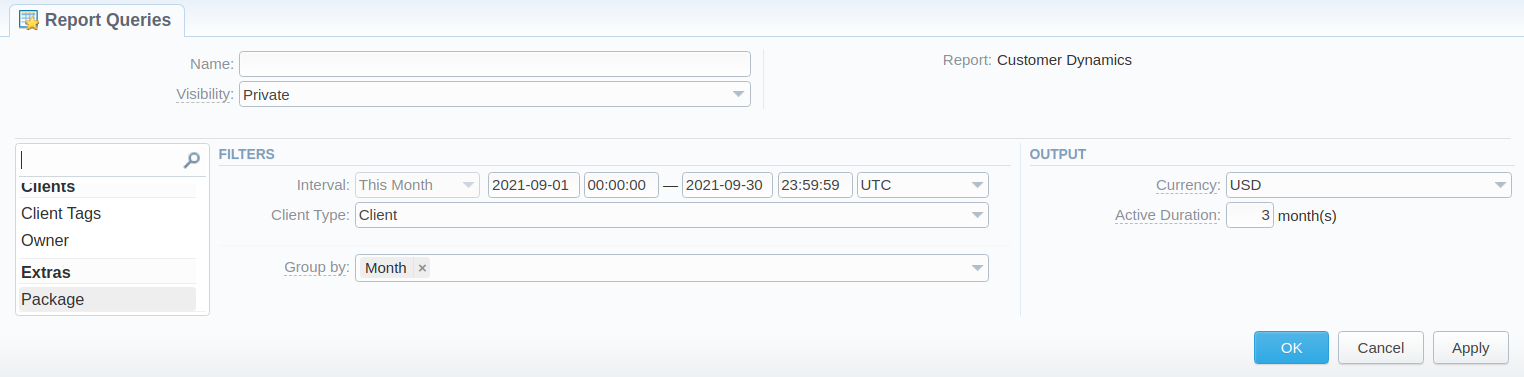
Also, you can create a template for reports and save specified parameters by clicking the "Save Query" button. A pop-up window with settings will appear and you need to fill in the following form:
To find more details about templates, please refer to the Report Queries article.
Customer dynamics buttons - export, chart
You can export data to a CSV and XLSx file, which contains only currently displayed data, with no automatic request to update data while exporting. Also, it is possible to create charts for illustrating crucial information easily:
-
To download a report in .csv, click the Export to CSV
 button above the report.
 -
To download a .xlsx file, click the Export to XLSx
 button above the report.
 -
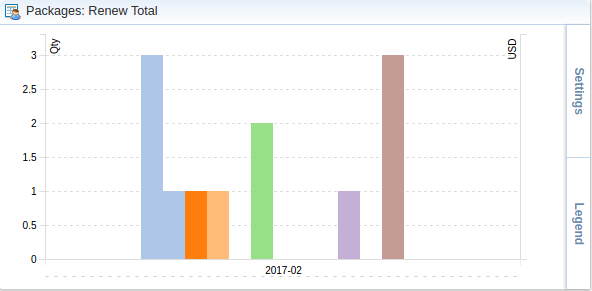
To create a visual chart, click the Show Chart
 button above the report. There is more information available on this topic in the article How to create a statistic chart? in our Knowledge Base. From the drop-down list on this option, you can find the next pre-configured templates for the chart:
- Clients - Active: Qty
- Balance Refill: Total
- Pay as you Go: Total
- Packages: Renew Total
- Blank Chart
Therefore, you can create a new chart or select Blank Chart to have a new empty worksheet for configuring a custom chart.
-
You can check an actual date interval by clicking on the Info icon. The displayed data could be different from the Interval specified above if there is no data for the period.
Sharing a report
Each time you get a report output, the system generates a unique link in the format of /view?id=<uniq-string>. It allows sharing data between the users, even if they belong to different resellers (the feature works similarly to Share by Link in Google Drive).
The link refers to the report data valid for a specific moment.
When you send a link to a report, you ensure the recipient would see the same data as you do. If you change data in the system (for example, perform rerating), the previously copied link to the report will display data valid for the moment of generation (even though the actual data is now different).
You can also view the additional information about the generated report by hovering over the Info icon, which is located under the Output section:
| Title | Description |
|---|---|
| Data Interval | States the period set for a report |
| Generated by | Indicates the Role of the user who generated a report and specifies a generation time |
| Duration | Time spent to generate a report |