Profit Report
Section overview
This section allows generating the profit report, which analyzes profitability data and defines profits between Reseller parties (companies and managers) and Clients belonging to the respective Reseller/Manager.
For example, when Manager1 executes a profitability report, it allows seeing their origination customers sending traffic to Manager_2, who owns the actual terminator vendors. In this case, _Reseller's permissions apply to every query, which guarantees that Manager1 will not be able to see any actual name of a _Client belonging to another manager, or another party that restricts such access.
Creating a Profit Report
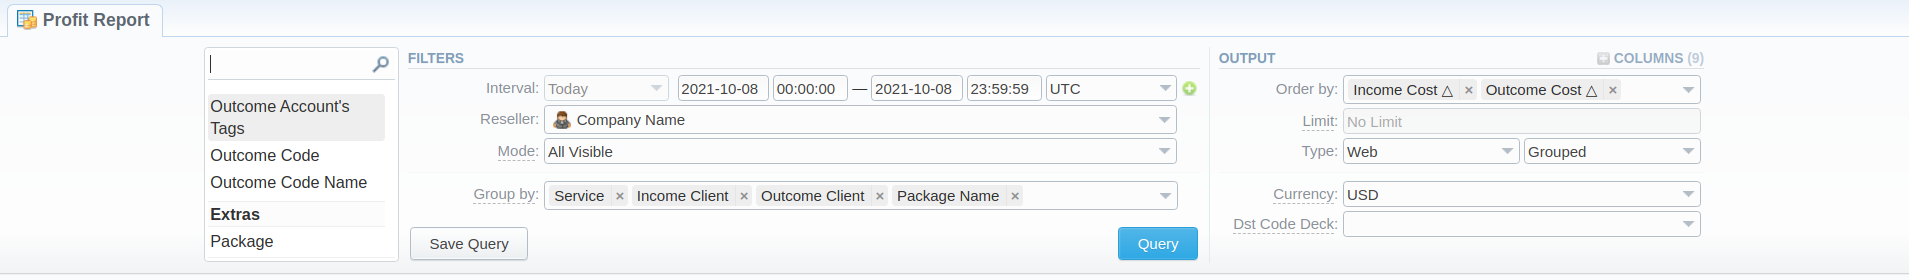
To generate a profit report, you need to fill in the required parameters in the form and click the "Query" button. To get information sorted, use the Group by option and choose respective values from the drop-down list.
The list of query fields is as follows:
Filters
On the Filters menu, select the required parameters for the report. To cancel any filter, click the delete icon next to the filter. You can start a quick search by typing filters' names in the field at the top of the drop-down menu with filters.
| Field | Description |
|---|---|
| Interval | Specify the time interval for the report and a timezone. Please note that the Interval field is mandatory. |
| Compare to | Accessible when you enable the Compare to option by clicking on the plus icon next to the Interval. Specify the second interval for the report. |
| Reseller | Specify the name of a target Reseller. |
| Mode | Choose the mode of the report: - All visible - all represented visually - Hide External Originators - all external originators of the selected manager will not be displayed - Hide External Clients - only events made solely between clients of the chosen manager will be shown. By default, the field value is set to All visible |
| Group by | Select a grouping option. Here you can choose and swap columns, as well as change their order. There are the following accessible options to group data in reports: - Time: Year, Month, Day, Hour - Clients: Income Client, Income Account, Income Code, Income Code Name, Orig Rate, Outcome Client, Outcome Account, Outcome Code, Outcome Code Name, Term Rate, Package name - Extras: Service Name, Income Series |
When you select one of the Time parameters for Group by, the end date of the Compare to will be set automatically to make equal intervals.
Please note that the Group by field is mandatory, it couldn't be left empty to generate the report.
Additional filters
The following filters are available:
- Clients: Income Client, Income Client's Tag, Income Account, Income Account's Tag, Income Code, Income Code Name, Income Owner User, Income Reseller, Outcome Client, Outcome Client's Tag, Outcome Account, Outcome Account's Tag, Outcome Code, Outcome Code Name.
- Extras: Package, Service
| Field | Description |
|---|---|
| Income Client | Specify an origination client(s) for the report |
| Income Client's Tag | Specify a tag(s) assigned to origination clients |
| Income Account | Determine an origination client's account(s) |
| Income Account's Tag | Indicate origination account's tags |
| Income Code | Define an incoming code |
| Income Code Name | Specify an incoming code name |
| Income Serial | Indicate a serial number of the originator's calling card |
| Income Reseller | Specify a target reseller(s) for the report |
| Outcome Client | Define a termination client(s) |
| Outcome Client's Tag | Define a termination client's tag(s) |
| Outcome Account | Indicate an account(s) of the termination client(s) for the report |
| Outcome Account's Tag | Specify termination account's tags if any |
| Outcome Code | Specify a termination code of the client |
| Outcome Code Name | Indicate a termination code name |
| Package | Determine the name of the used package |
| Service | Specify the service |
Output
This section contains settings of the report output data.
Click a plus sign next to Columns and select required columns to add them to the Output information block. Also, you can cancel any chosen item.
Accessible columns in the report
Additional columns of the report are:
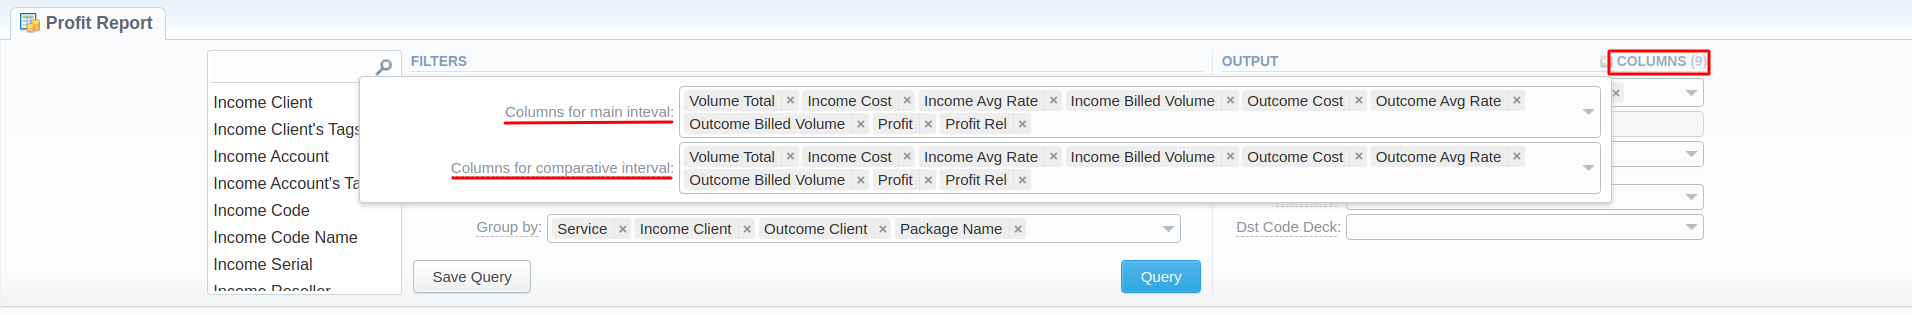
Columns for the main interval: Volume Total, Income Cost, Income Avg Rate, Income Billed Volume, Outcome Cost, Outcome Avg Rate, Outcome Billed Volume, Profit, Profit rel.
Columns for the comparative interval: Volume Total, Income Cost, Income Avg Rate, Income Billed Volume, Outcome Cost, Outcome Avg Rate, Outcome Billed Volume, Profit, Profit rel, Profit (%), Profit rel (%), Income Cost (%), Outcome Cost (%), Income Avg Rate (%), Outcome Avg Rate (%), Income Billed Volume (%), Outcome Billed Volume (%), Volume Total (%).
And it's possible to choose each parameter expressed in percentage.
| Column | Description |
|---|---|
| Volume Total | Total time of calls in minutes |
| Income Avg Rate | An average call rate that is used for origination |
| Outcome Avg Rate | An average call rate that is used for termination |
| Profit | A revenue in a respective currency (in fact, any system currency can be specified here) |
| Profit rel | A revenue in percent value |
| Income Billed Volume | The whole billed time for origination |
| Outcome Billed Volume | The whole billed time for termination |
| Income Cost | A call cost that is used for origination |
| Outcome Cost | A call cost that is used for termination |
Other output settings
| Field | Description |
|---|---|
| Order by | Select parameters to sort already grouped data in columns. There are the following accessible options to order the data: by Time, Clients, Extras. Here you can sort data from highest to lowest values (or vice versa) and select different values. |
| Type | Choose a report format from a drop-down list: Web/CSV/Excel XLS/Excel XLSx. Also, select a table view next to the Type field: - Plain - a simple table view - Grouped - a table view with grouped data and possibility to collapse/expand it |
| Limit | Determine the number of rows that will be visible in the report. It is useful for displaying some top positions by a chosen parameter. It is available only for the plain type of report. |
| Send to | You can send generated reports via email. Also, it is possible to specify several emails. Available only for CSV, Excel XLS, Excel XLSx formats; it doesn't work with Web. |
| Currency | Specify a currency for the report. All values will be automatically converted to the specified currency in the report. |
| Code Deck | Using a drop-down list, select a respective code deck. All code names will be rewritten and presented according to the specified code deck. If there is no value specified, the code deck assigned to the Client or Rate Table will be in usage. |
Please note that the Grouped type of a table view is available only for Excel XLSx and Web formats, it doesn't work with CSV.
A generated profit report is demonstrated on a screenshot below:
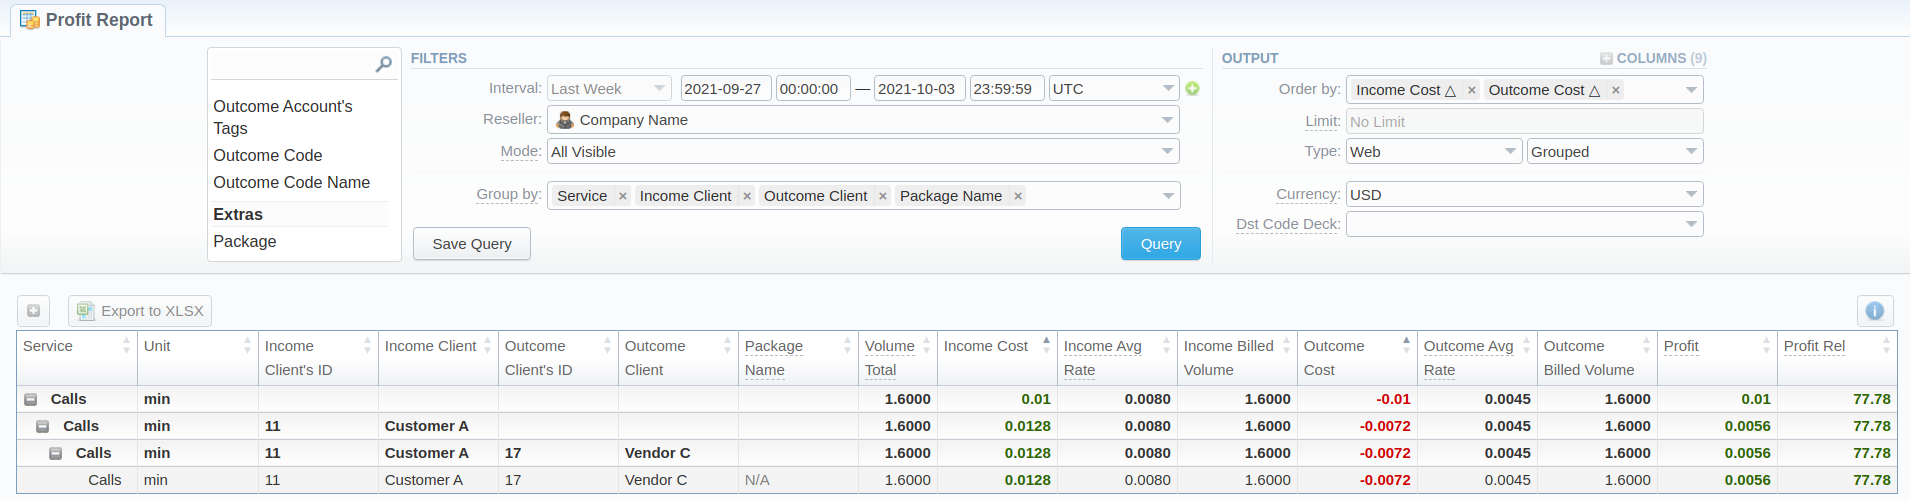
If the data is grouped in the report, it will be shown initially collapsed. To expand or collapse data in your report, click the plus or minus icons.
Please note that the system shows rounded values in the reports. However, while calculating the system takes an exact value. Hence, the procedure of the rounding is as follows:
- the system rounds currency values according to the settings of a respective currency;
- other parameters are rounded to the nearest ten thousandths. For example 3.879256 to 3.8793.
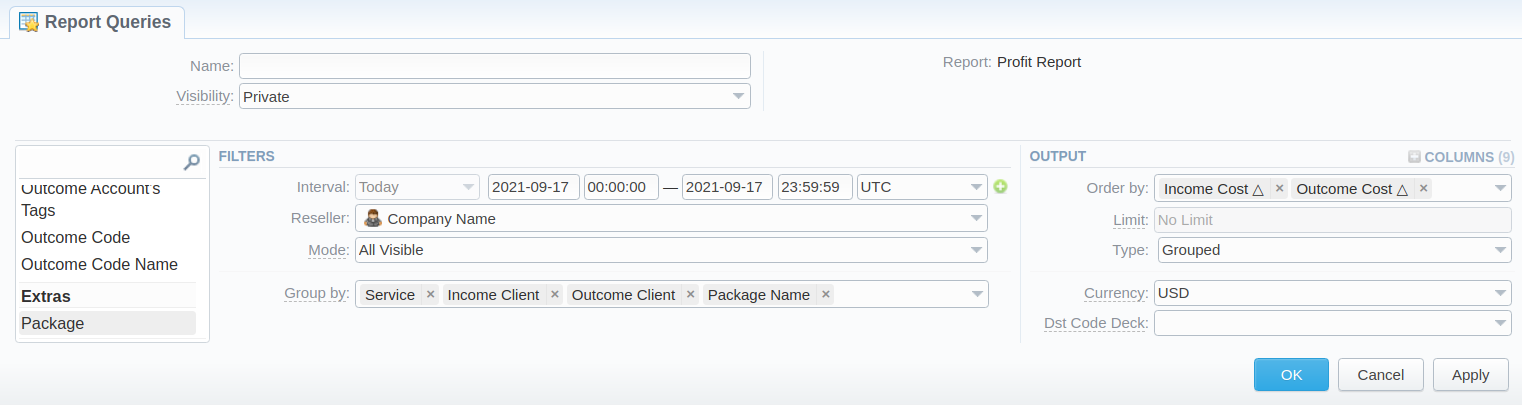
Creating a Query Template
A user can create a template for profit reports and save specified parameters by clicking the "Save Query" button. A pop-up window with settings will appear and you will need to fill out the following form:
To preview or load already existing templates while generating statistic reports, click the "Load Query" button and click on a template name or click a run icon.
Export a generated report
You can export data to XLSx or CSV file, which contains currently presented data by clicking the Export to XLSx or Export to CSV button respectively. Please note that Export to CSV is available only when the Type of the output is Plain.
You can check an actual date interval of the report by clicking the Info icon, and it could be different from the Interval specified above if there is no data for the period.
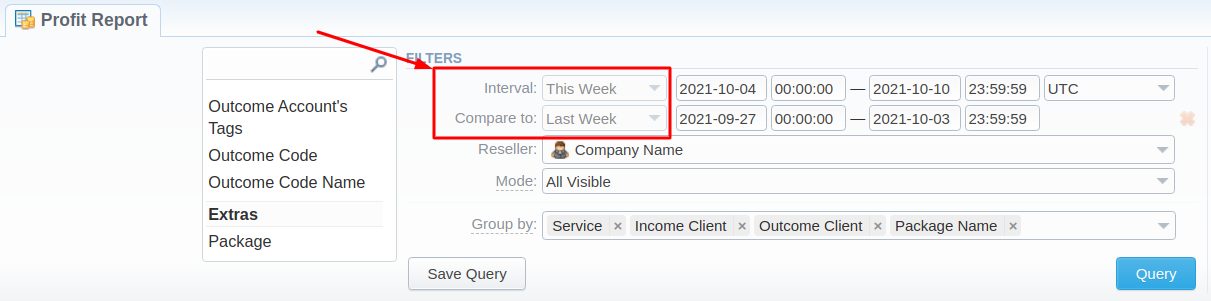
Side-by-side report
This tool allows building a report with side-by-side sub-reports. Use it to run a comparative analysis on the same page. It's helpful for reviewing multiple parameters, totals and compare results at different time intervals. The Compare to option is designed to create a report that shows two sub-reports side-by-side. To enable this option, click on the plus icon next to the Interval field and specify both intervals for the report.
Then choose columns for the main and comparative period in the report Output form. When all required parameters are specified, click the "Query" button.
To remove this filter, please click the delete icon.
You can modify a comparative mode by changing periods and columns. For example, to compare how different the profit of the two periods is, choose the Profit value from the Columns. Therefore, the final report splits Profit into separate columns (see screenshot below).
Sharing a report
Each time you get a report output, the system generates a unique link in the format of /view?id=<uniq-string>. It allows sharing data between the users, even if they belong to different resellers (the feature works similarly to Share by Link in Google Drive).
The link refers to the report data valid for a specific moment.
When you send a link to a report, you ensure the recipient would see the same data as you do. If you change data in the system (for example, perform rerating), the previously copied link to the report will display data valid for the moment of generation (even though the actual data is now different).
You can also view the additional information about the generated report by hovering over the Info icon, which is located under the Output section:
| Title | Description |
|---|---|
| Data Interval | States the period set for a report |
| Generated by | Indicates the Role of the user who generated a report and specifies a generation time |
| Duration | Time spent to generate a report |