System Status
System Status displays all currently launched system services, system load info and current system database sessions of the main server, divided into two information blocks: Localhost and Master Database Sessions. In addition, this section displays the status of Redundancy and Reporting servers. Section structure is a follows:
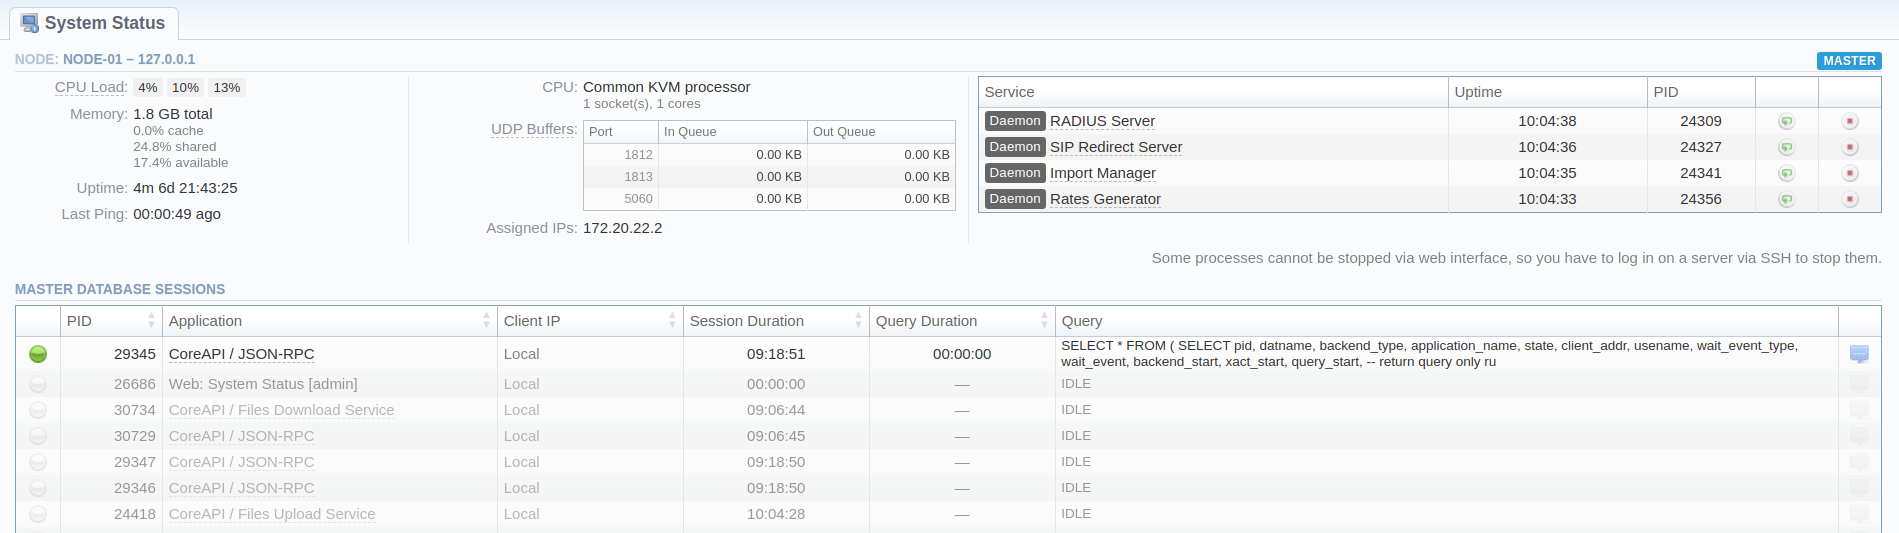
Node: [node_ident]-[ip]
| Column name | Description |
|---|---|
| CPU Load | CPU utilization within 1 min, 5 min, and 15 min periods |
| Memory | Amount of Total Memory with breakout for cache, shared, and available |
| Uptime | Current uptime of the system |
| Last Ping | A timestamp of how long ago we received a ping from the server |
| CPU | Number of Central Processing Unit cores |
| UDP Buffers | List of UDP ports with queue size in incoming/outgoing queues |
| Assigned IPs | Current server IP(s) |
| Service | Name of the system service. If the service is a daemon, it will be marked accordingly |
| Uptime | Current uptime of the service |
| PID | Process ID of the system service |
Master database sessions
| Column name | Description |
|---|---|
| PID | Database session process ID |
| Application | Name of the application |
| Client IP | IP of the server, accessing the Master database |
| Session Duration | Session duration |
| Query Duration | Query duration |
| Query | Description of the query |
The section allows a user to stop, and restart services manually with the help of certain icons.
| Icon | Description |
|---|---|
 | Allows to restart a service that is currently running |
 | Allows to stop a service |
warning
Note that you cannot stop some processes via the web interface. To do so, you need to login on a server via SSH to stop them.