Active Sessions
This section provides an easy and convenient active sessions monitoring tool. Upon access, you can see the full list of active sessions that are currently being processed by your switch.
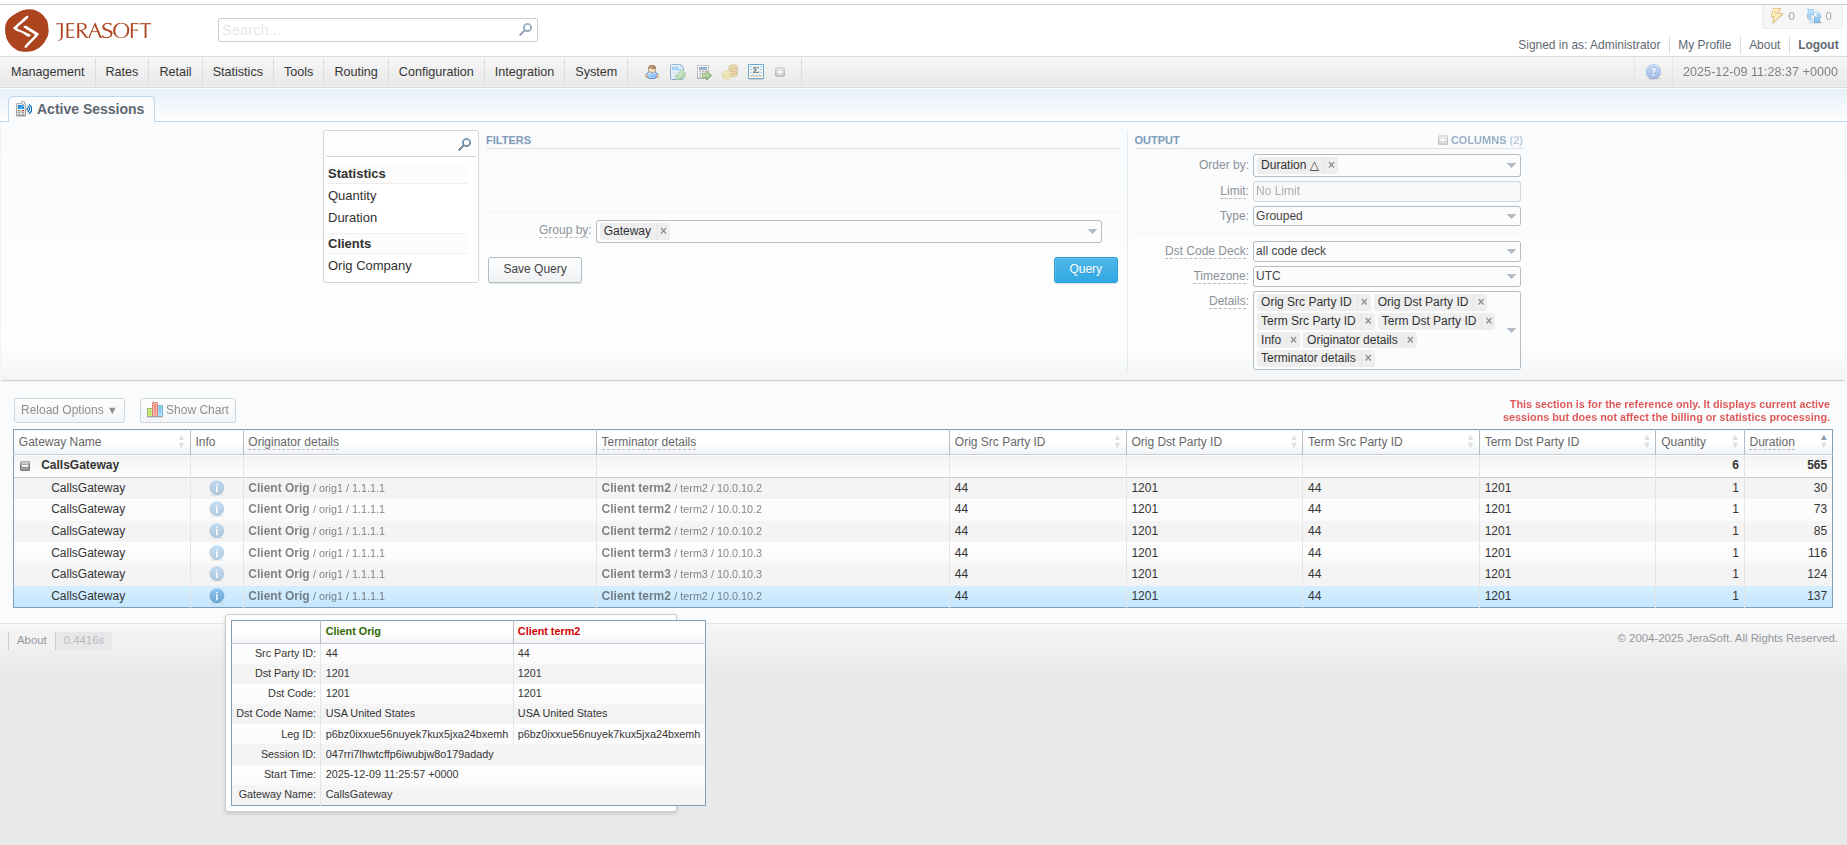
If the data is grouped in the report, it will be shown initially collapsed. To expand or collapse data in your report, click the plus or minus icons.
Please note, this function requires RADIUS Accounting Start packets to be sent from your Gateway and the Track Active Events option enabled in the Gateways section.
Be advised that the Track Active Events option diminishes system performance. Please, activate it only if you use capacity control by billing and/or require active sessions status monitoring.
Creating an Active Sessions report
To create a report, fill in the query form with the parameters specified below, and click the Query button.
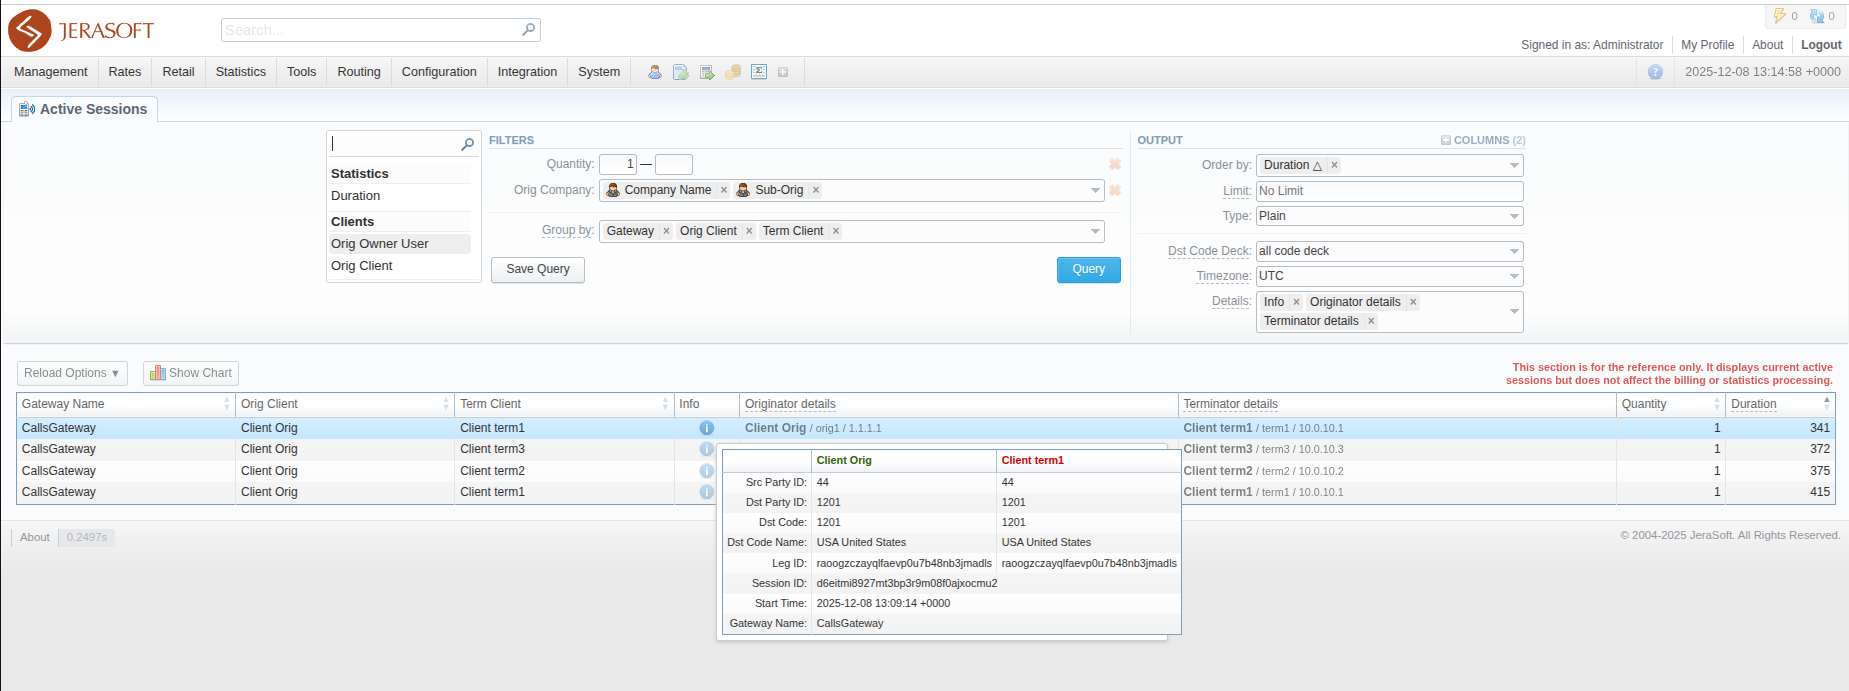
Filters
On the Filters menu, select the required parameters for the report. To cancel any filter, click on the delete icon next to the filter.
You can start a quick search by typing filters' names in the field at the top of a drop-down menu with filters. Currently available report filters include:
- Statistics block:
- quantity
- duration
- Clients block:
- orig / term company
- orig / term owner user
- orig / term client
- orig / term account
- Rates block:
- orig / term code
- orig / term code name
Group by
Select a grouping option. Here you can choose and swap columns, or change their order. There are the following accessible options to group data in the report:
- Clients block:
- orig / term client
- orig / term account
- Rates block:
- orig / term code
- orig / term code name
- Events block:
- gateway
- session ID
- setup time
- orig / term account ident
- orig / term leg ID
- orig / term src / dst party ID
Output
This section contains settings of the report output data. Click the plus icon next to Columns and select the required columns to add them to the Output information block. Also, you can cancel any chosen item.
There are the following additional columns to add to the report:
| Column | Description |
|---|---|
| Quantity | Quantity of sessions |
| Duration | Session duration, specified in seconds |
The default output columns are:
| Column | Description |
|---|---|
| Gateway Name | Name of the Gateway |
| Orig Client | The name of the originator |
| Term Client | The name of the terminator |
| Orig Src Party ID | The source number |
| Term Dst Party ID | The destination number |
Other output settings
| Field | Description |
|---|---|
| Order by | Select parameters to sort already grouped data in columns. Here you can sort data from highest to lowest values (or vice versa) and select different values. |
| Type | Choose a format of the report from a drop-down list: Web / CSV / Excel XLS / Excel XLSx. Also, select next to the Type field a look of table view: - Plain - a simple table view - Grouped - a table view with grouped data and possibility to collapse it |
| Limit | Determine the number of rows that will be visible in the report. It is useful for displaying some top positions by a chosen parameter. It is available only for the Plain type of the report. |
| Dst Code Deck | Specify a Code Deck to force Code Names for the displayed data. If not specified, Code Decks of the respective Clients/Rate Tables will be used. |
| Timezone | Specify a Timezone for data output. If not selected, the user's Timezone will be used. |
| Details | Select additional columns for output to be used for grouping alongside the "Group By" columns. Available columns are: "Info", "Originator details", "Terminator details", "Orig Src Party ID", "Orig Dst Party ID", "Term Src Party ID", "Term Dst Party ID". |
Please note that the Grouped type of a table view is available only for Excel XLSx and Web formats, it doesn't work with CSV and Excel XLS.
Query templates
Also, you can create a template for reports and save specified parameters by clicking the Save Query button in the form. A pop-up window with settings will appear, and you will need to fill in the form. A detailed description of creating a template can be found in the Report Queries article in our User Guide.
To load already existing templates while generating statistic reports, click the Load Query button and the  icon opposite a target template on the list.
Active Sessions buttons: reloading and charts
- To set a reload interval of the report, click the respective Reload Options button and select needed values in the Interval and Show Last fields.
The Show Last field defines the period, for which data is generated in a report. For example, if you want to display the data for 1 day, specify it in the Show last field.
- To create a visual chart, click the Show Chart
 button above the report. There is more information available on this topic in the article How to create a statistic chart? in our Knowledge Base.
If you want to create a proper line chart for different clients, please follow these steps:
- choose the Orig Client parameter in the Group by field.
- click the Show Chart button and open the chart settings.
- select the Date and Time parameters on the X Axis, and the Calls Total parameter on the Y Axis.
- specify a line type of the chart and click on the Save button.