Rates Analysis 2.0
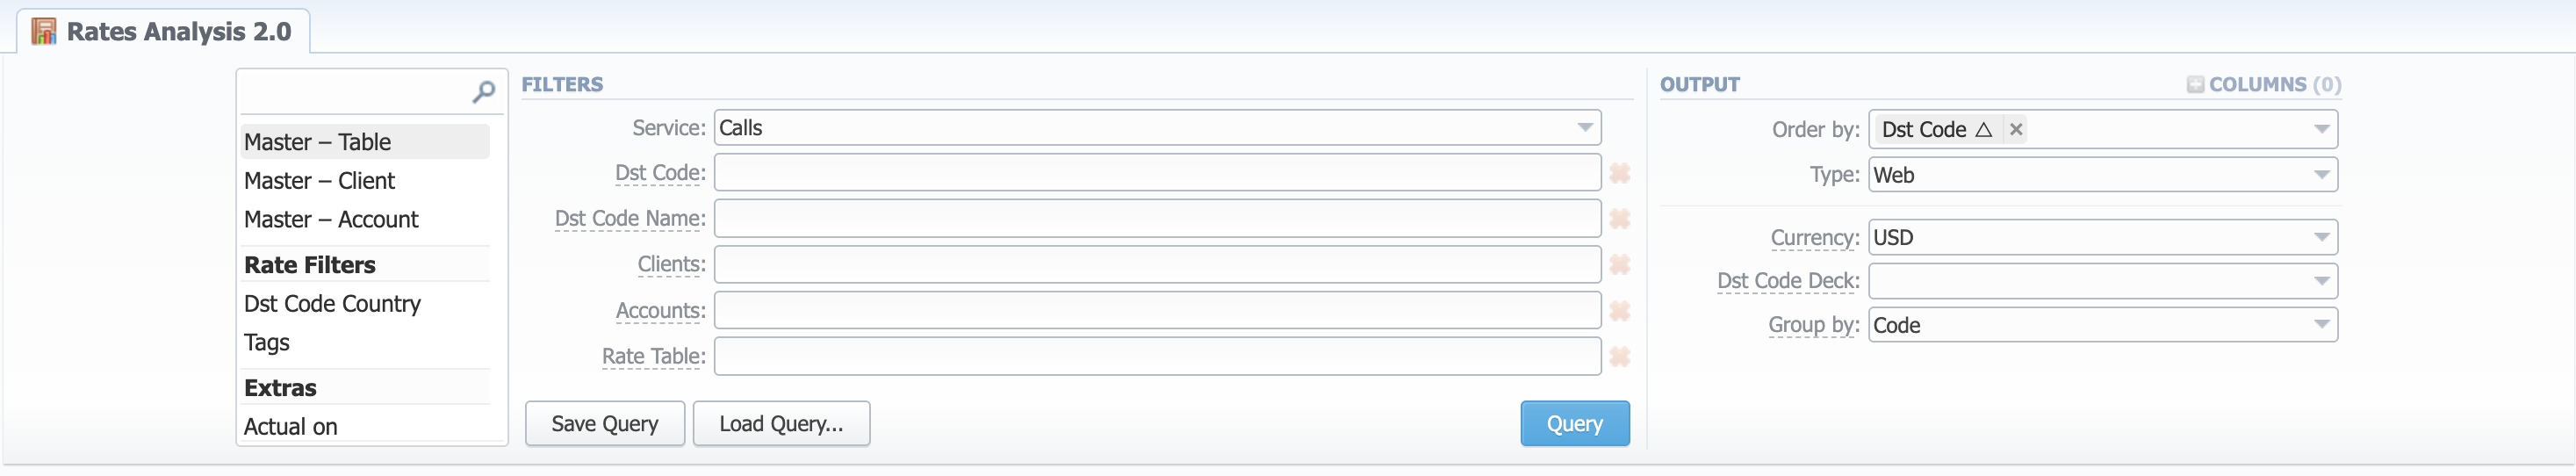
Rates analysis form
Rates Analysis is an advanced feature of the JeraSoft Billing Rates Management Module. It allows analyzing and comparing rates within the billing web interface without using any third-party software.
Creating a new analysis report
To analyze and compare different rates, you need to fill in the form with the next parameters:
Filters
On the Filters menu, select the required parameters for the report. To cancel any filter, click on the delete icon next to the filter. You can start a quick search by typing filters' names in the field at the top of a drop-down menu with filters.
| Field | Description |
|---|---|
| Service | Select a service for rates analysis. Default is "calls" |
| Dst Code | Specify a code of the needed destination |
| Dst Code Name | Define a code name of the desired destination |
| Clients | Indicate termination clients for analysis |
| Accounts | Indicate termination accounts for analysis |
| Rate Table | Define rate tables for analysis |
If a vendor does not have a Rate for the specified longer Dst Code, it would be simulated from an existing shorter one.
Additional Filters:
| Category | Filter | Description |
|---|---|---|
| Master Source | Master - Table | Specify a rate table that all other rates will be compared to |
| Master - Client | Specify an origination client that all other rates will be compared to | |
| Master - Account | Specify an origination account that all other rates will be compared to | |
| Rate filters | Dst Code Country | Enter the name of the respective country |
| Tags | Indicate a tag, which relates to specific Rates or Rate Tables | |
| Extras | Actual on | Define the date, when the rates should be effective on. Applies both to Effective Date and Time Profile |
| Volume Interval | Specify the number of days of statistics that would be taken for analysis |
Output
This information block contains settings of the report output data.
| Field | Description |
|---|---|
| Order by | Select parameters to sort already grouped data in columns. Here you can sort data from highest to lowest values (or vice versa) and select different values. |
| Type | Choose a format of the report from a drop-down list: Web, CSV, Excel XLSx. If CSV or Excel XLSx is selected, an additional Send to field will be displayed to specify emails where the report will be sent. |
| Currency | Specify the currency of the report. All values will be automatically converted to the specified currency in the report. |
| Dst Code Deck | Select a code deck from a drop-down list. All codes in the following report will be presented according to the specified code deck. Not mandatory by default, but required if you have any destination name-related filters and/or Group by Code Name. |
| Group by | Select a grouping option: - Dst Code - aggregation by default output - Dst Code Name - grouping by rate rows with the same names and rates for all codes in each rate table. The system will automatically group data in specified columns. If certain termination entities have different prices within the same Code Name, the rows will be displayed separately. |
Click the "Plus" icon next to Columns and select the required additional columns to add them to the Output information block. Also, you can cancel any chosen item.
The list of additional columns include:
| Column | Description |
|---|---|
| Sources Volume | Calculated based on Summary Report |
| Sources Quality | Calculated based on Summary Report. Quality parameters for traffic — ASR and ACD — are available per row |
| Master Volume | Calculated based on Orig-Term report |
| Master Profit | Calculated based on Orig-Term report. The relative and absolute Profit is displayed per destination |
| Master Routes | Shows how many accepted routes there are according to the Routing Plan on the selected master entity. When clicked, prompts you to the Routing Analysis for the respective case |
A master filter must be selected for any master-related output columns.
By default, the system takes statistics for the last 7 days. You can alter this value by specifying a Volume Interval filter.
After clicking the Query button, the system will form a list of rates with prices for each destination. The appeal of rates is visualized as a heat map for convenience. The darker the red - the least profitable, the brighter the green - the more, respectively.
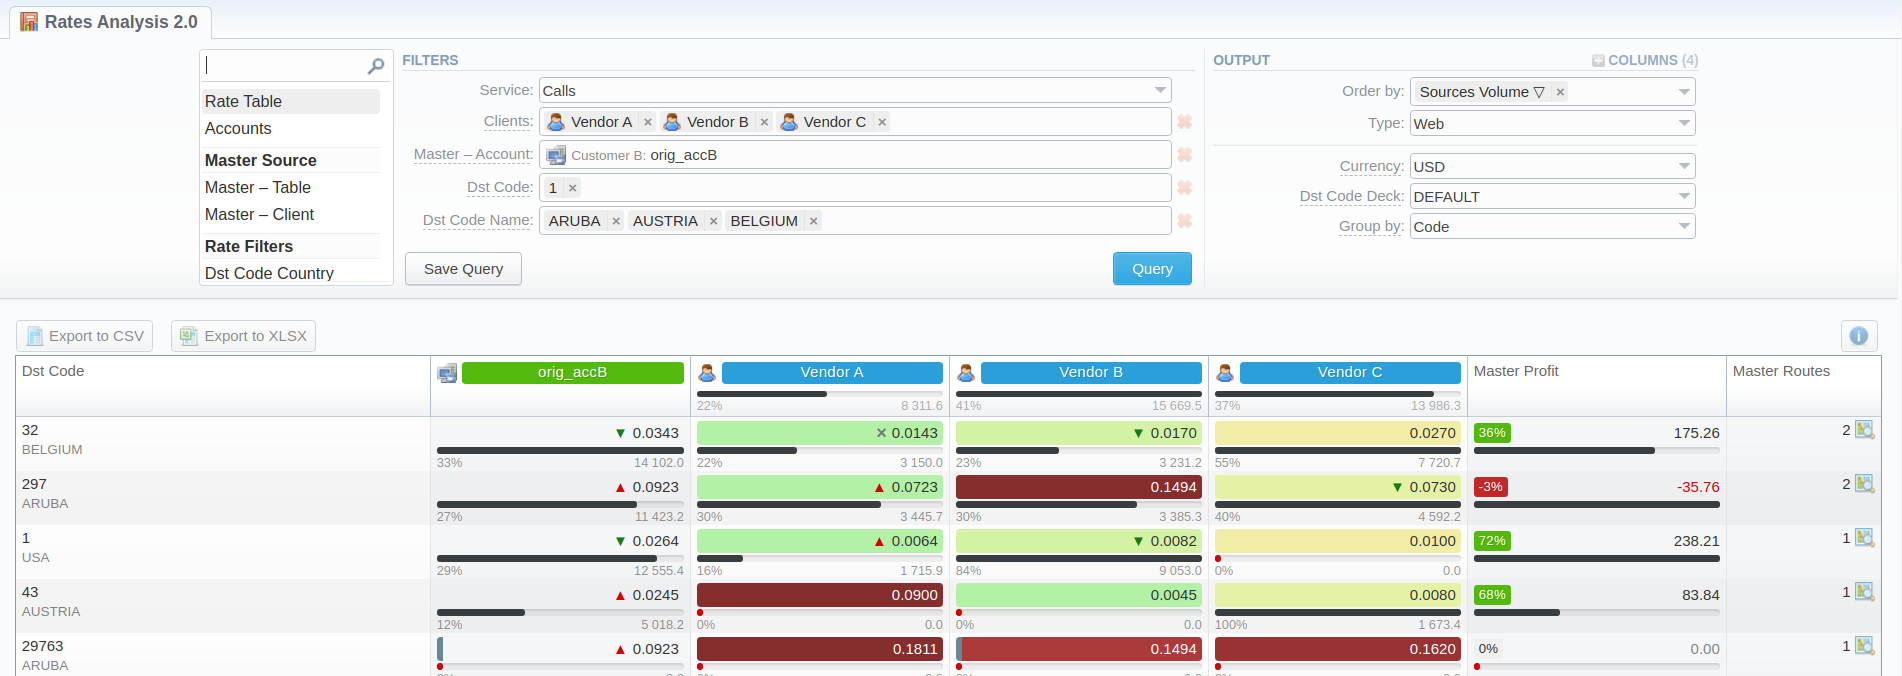
To see the user's name, time/date, when a report was generated, and duration, hover over the Info icon above the report on the right.
![]()
The Rates Analysis 2.0 output may display a warning icon next to the Rate value to alert of changes in the following parameters of a Rate:
- Rate value
- Min Volume
- Interval
- Grace Volume
- Setup Fee
You can see the details of the respective warning if the output is grouped by Code.
- The margins cannot be calculated for a blocked destination, so, in the output, they are omitted;
- If the Master Source has a blocked Rate, margin calculation works between sources (as for missing Rates).
Origin-based rates are currently not shown within the report, just as rates with src codes.
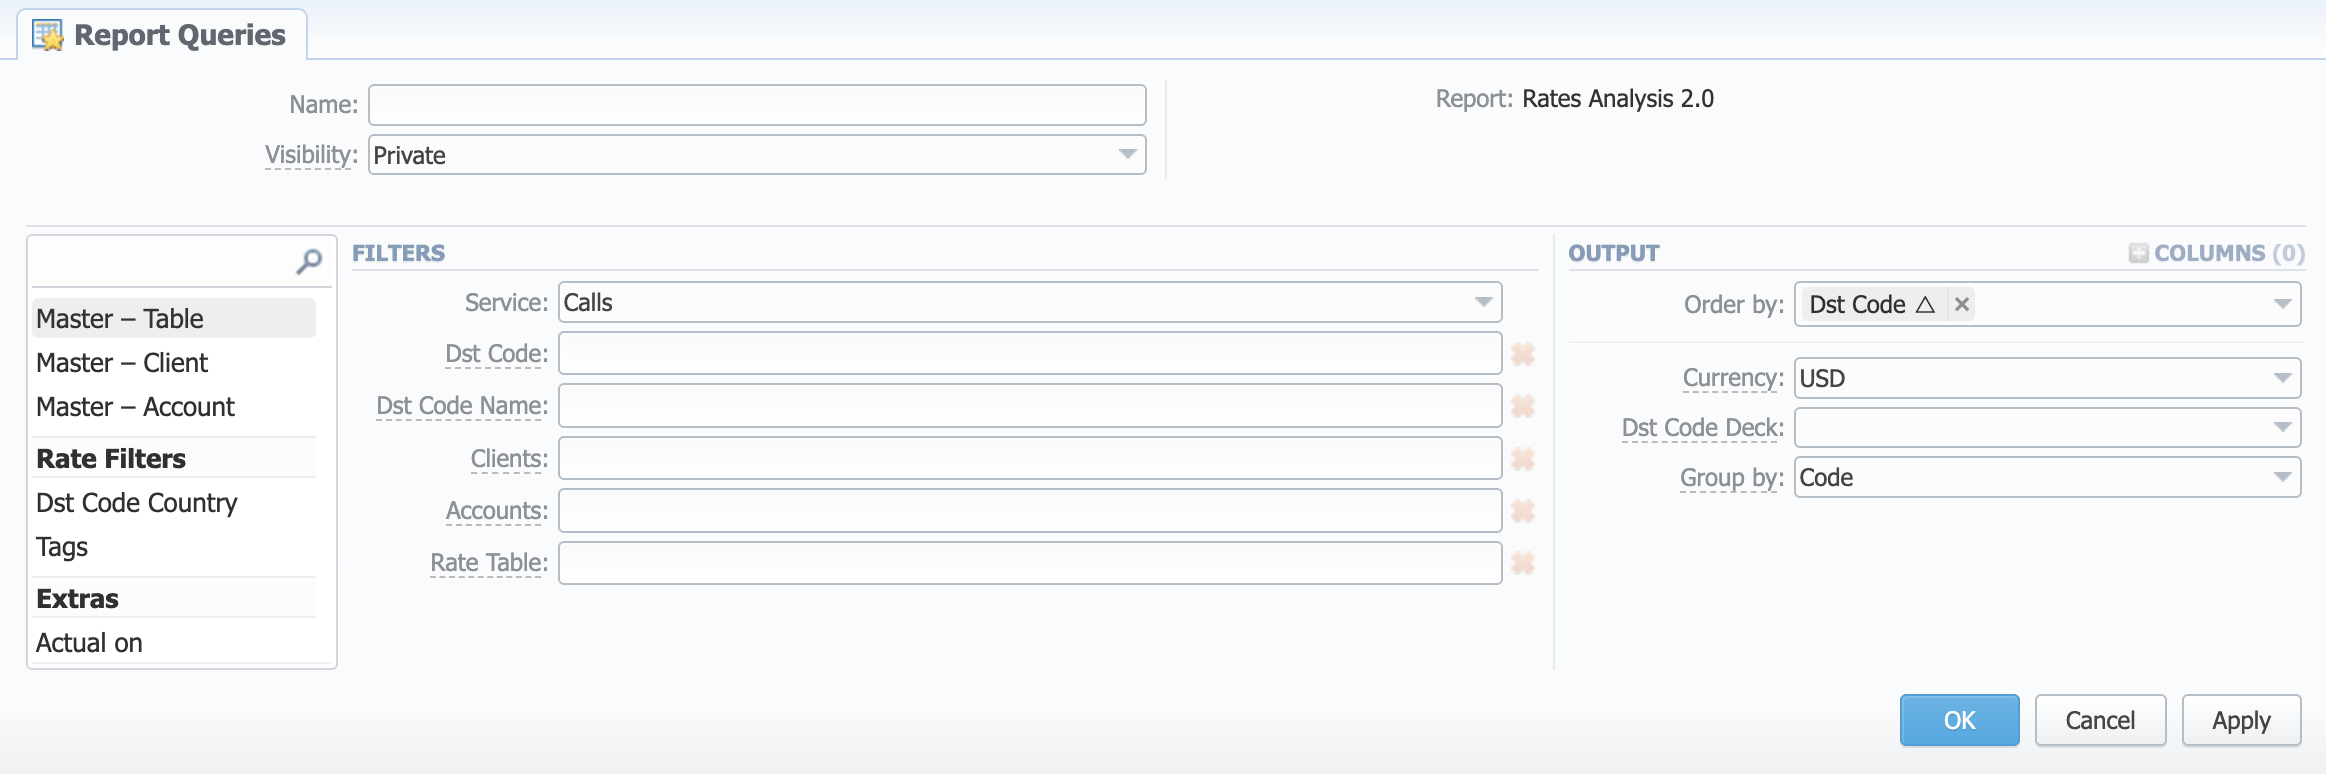
Creating a new Report Query
Also, you can create a template and save specified parameters by clicking the Save Query button. A pop-up window with settings will appear, where you need to fill out the following form:
After a template has been created, a new Load Query button will be added to the section. By clicking it, you can select report settings to be filled in from a list of templates for rates analysis.
Export generated report
You can export report data either in .xlsx file or .csv that would contain currently presented data. Click the Export to XLSx or Export to CSV button above the report output to download a file of the respective format.
Sharing a report
Each time you get a report output, the system generates a unique link in the format of /view?id=<uniq-string>. It allows sharing data between the users, even if they belong to different resellers (the feature works similarly to "Share by Link" in Google Drive).
The link refers to the report data valid for a specific moment.
Example: When you send a link to a report, you ensure the recipient would see the same data as you do. If you change data in the system (for example, perform rerating), the previously copied link to the report will display data valid for the moment of generation (even though the actual data is now different).
You can also view the additional information about the generated report by hovering over the Info icon, which is located under the Output section:
| Field | Description |
|---|---|
| Generated by | Indicates the Role of the user who generated a report and specifies a generation time |
| Duration | Time spent to generate a report |