Routing Analysis
Section overview
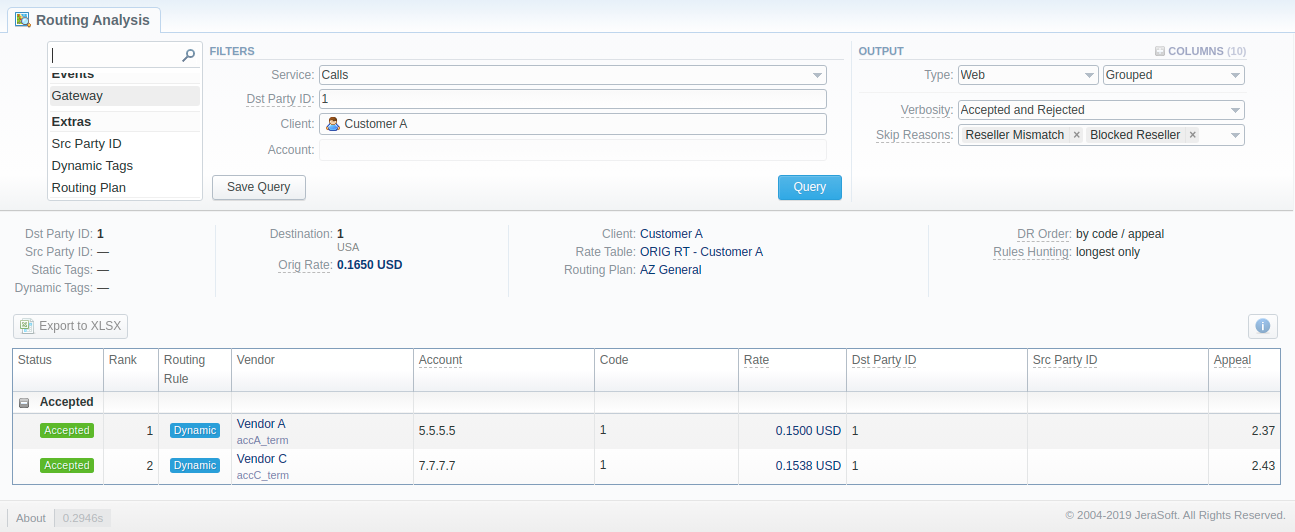
This section represents a route analyzer tool that allows to manage dynamical routes and simulate different routing models without hurting live voice traffic. It should be noted that this tool can be used only in case you are using the Dynamic Routing feature.
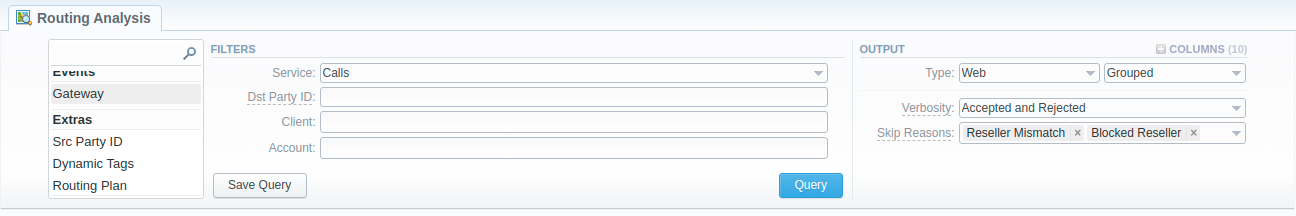
The Routing Analysis section represents a query form with the following parameters:
Please note that if there are changes in the term Rate Table, you need to launch Dynamic Routing Manager in the System Services section. Routing Analysis shows routes based on the routing table built on the last run of the Dynamic Routing Manager. So you won't be able to see the latest changes regarding the routing rules until the Dynamic Routing Manager is restarted.
Creating a Routing Analysis Report
To generate a routing analysis, enter the next parameters in the query form:
Filters section
Here you can select the desired parameters for the report. To cancel any filter, click the delete icon next to it. You can use a quick search by typing filters' names in the respective field at the top of the filters list.
| Filter | Description |
|---|---|
| Service | Select the service for the report. By default, the field value is set to "Calls". This field is mandatory |
| Dst Party ID | Enter the destination party ID to define a destination. This field is mandatory |
| Client | Select a client for the report. Also, you can specify respective call shops. This field is mandatory |
| Account | Select an account for the report |
There are the following accessible additional filters:
- Events: Gateway.
- Extras: Src Party ID, Dynamic Tags, Routing Plan.
| Filter | Description |
|---|---|
| Gateway | Define a gateway specified in the term account |
| Src Party ID | Specify a source number or any other source identification to check the translations |
| Dynamic Tags | Enter additional dynamic tags for this routing |
| Routing Plan | Enter the plan with a respective routing rule |
Output
This form contains settings of the output data of the report. Click the plus icon near Columns to select respective columns to output report data. Also, you can cancel any chosen item.
The following columns can be added to the report:
-
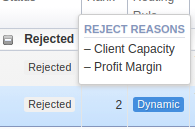
Status: this column displays the following information: the state of the route, reject reasons (if any):
 for accepted route
 for rejected route
To view detailed information on a rejected route status, hover over a corresponding icon in the column.
-
Rank: the vendor position during routing. It's applicable and the system puts values in order when route status is accepted.
-
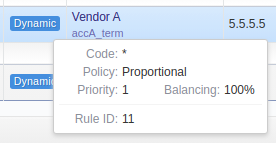
Routing Rule: the route type including destination, policy, rule properties (balancing, priority), time profile, orig & term tags, debug information:
- A grey
 icon in the column shows a static route
 - A violet
 icon indicates a DID route
 - A blue
 icon in the column shows a dynamic route
To view detailed information on a route type hover over a corresponding icon in the column.
- A grey
-
Vendor: the name of the respective terminator specified in the Client's settings and its account name
-
Account: the name or IP of the account
-
Code: matched code in the terminator's rate table
-
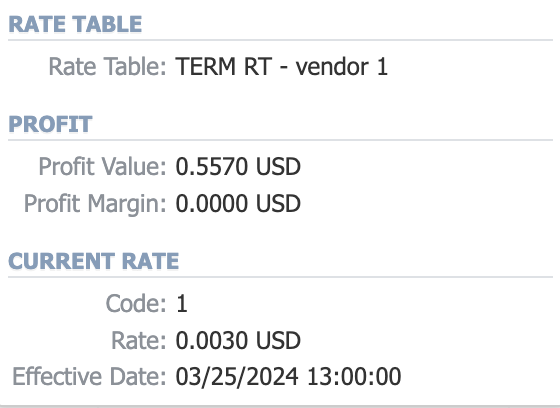
Rate: a rate that is used to terminate the call
To view detailed information on a rate, hover over a corresponding value in the output.
-
Dst Party ID: shows destination party ID that is sent to the provider when all matching number translations are performed
-
Src Party ID: shows source party ID after all number translations
-
Appeal: shows the appeal automatically calculated by the system according to the chosen DR Policies
The Appeal is displayed as a value if a route is dynamic. If a route is static, it's displayed as "N/A". Regardless of the route type, you can hover over the appeal value to get additional insights on ASR, ACD, SCD, PDD, Vendor Debt, Payment Due, Stats Qty.
-
Reject Reasons: displays respective rejection reasons for a particular route
Other output settings:
| Field | Description |
|---|---|
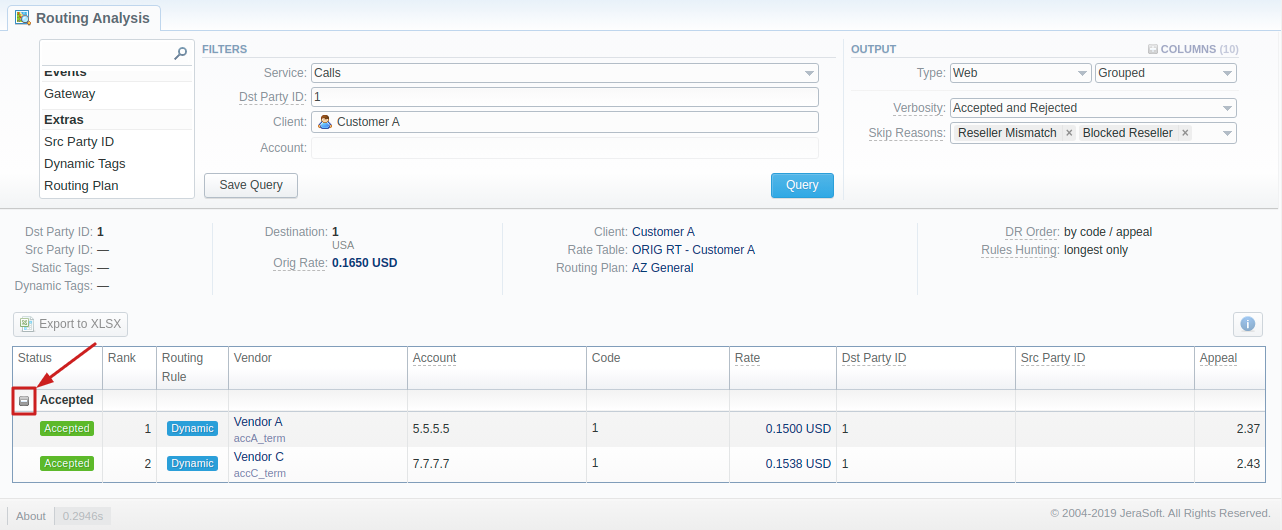
| Type | Select a report format from a drop-down list: Web/CSV/Excel XLS/Excel XLSx. Also, select a look of table view next to the Type field: - "Plain" - a simple table view - "Grouped" - a table view with grouped data and possibility to collapse it |
| Verbosity | Select which routes should be displayed ("accepted and rejected" or "accepted only") |
| Skip Reasons | Specify the reasons under which routes should be excluded from the output list. The available skip reasons are: - Reseller Mismatch - Blocked Reseller - Blocked Client - Blocked Account - Vendor Qty - Stop Hunting - Party ID Length - Profit Margin - Rate Increments - Orig Tags - Term Tags - Traffic Processing - Reseller Capacity - Client Capacity - Account Capacity - Rule Capacity - Quality - Vendor Credit Limit |
Please note that the Grouped type of a table view is available only for Excel XLSx and Web formats, it doesn't work with CSV or Excel XLS.
If CSV, Excel XLS or Excel XLSx type has been selected, an additional Send to field will be displayed. In this field, you can specify emails of the clients, where the current report in the selected format will be sent.
After selecting all needed parameters, click the Query button, and the system will generate a report.
Moreover, you can create (save) and display previously saved report templates by clicking Save Query and Load Query, respectively. Remember that the load button will be present only if there is at least one routing analysis report in the Report Queries section.
For more details about templates, refer to the Report Queries article.
In the Routing Analysis output, various insights are helping you to understand what might be special about the traffic flow or configuration:
- The system displays Client and Account Capacity to alert about capacity limitations;
- You can see what Allowed Volume value we will give at the time of authorization request;
- A red warning is displayed if the Client (or Reseller) has a balance less than or equal to 0;
- During the analysis, you can see, which Routing Plan is used for the routing choice (in case of additional Routing Plans scheme usage) – there is an indication badge on the Routing Rule tooltip.
Please mind the naming of your codes. For example, if your client has:
- a "447911" code in a Rate Table,
- an assigned Code Deck that has only "44-UK", but not "447911",
- an assigned Routing Plan with a static rule for "UK" to a vendor,
in the Routing Analysis you will not see this vendor as available for a call to, say, "4479110000", even though the orig parameters state a Code Name as "UK". This happens, because it's a simulated Code Name (from "44" Code, present in a Code Deck).
If you'd like to see the said vendor, the code should be either "447911", or "44*".
To expand or collapse data in your report, click the plus or minus icons. If the data is grouped in the report, it will be shown as initially expanded.
- If the rate is blocked for the originator, the routes will not be displayed.
- If a terminator has a direction blocked, the route will be rejected with the corresponding status ("Blocked Rate").
- If the Routing Policy contains the Rate factor, the appeal value for blocked rates is set to a high value of "1000", regardless of the values of any other factors.
If applicable, you can check the future terminator's rate in the report by hovering over the current rate in the Term Rate column.
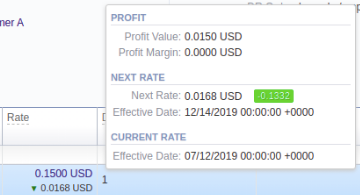
Please note that it analyses the profitability by comparing orig and term rates. Therefore, an orig rate should be equal or greater than a term rate and profit margin.
Please note that if a Reseller has an orig rate assigned, the profit margin will be counted taking into account both client-originator's rate and Reseller's rate.
By hovering over the Info icon above the report on the right, user's name and time/date when a report was generated will be displayed in a pop-up window.

Export a generated report
You can export report data either in a .xlsx or .csv file that would contain currently presented data. Click the Export to XLSx or Export to CSV button to download a file of the respective format. Be advised that the Export to CSV button is only available if Output is set to Web/Plain.
- Inactive additive rates with non-zero value (for respective tags) won't be shown. Active additive rates with zero value will be shown.
- If you change the currency in the Settings, you need to restart the Dynamic Routing Manager in the System Services section for immediate Routing Analysis functioning.
Sharing a Report
Each time you get a report output, the system generates a unique link in the format of /view?id=<uniq-string>. It allows sharing data between the users, even if they belong to different resellers (the feature works similarly to Share by Link in Google Drive).
The link refers to the report data valid for a specific moment. For example, when you send a link to a report, you ensure the recipient would see the same data as you do. If you change data in the system (for example, perform rerating), the previously copied link to the report will display data valid for the moment of generation (even though the actual data is now different).
You can also view the additional information about the generated report by hovering over the Info icon, which is located under the Output section:
| Field | Description |
|---|---|
| Generated by | Indicates the Role of the user who generated a report and specifies a generation time |
![]()