Docs for all releases
Page History
The Dashboard is the customizable section with charts that provide a vivid visual representation of the most relevant report data in one place.
It allows you to monitor your customer's activities in real-time by providing visual charts on some most crucial information. Here you can find all the charts that were created in the Summary Report, Orig-Term Report and Active Calls sections, and exported to the Dashboard.
To know more about charts, visit our "How to create a statistic chart?" article in Knowledge Base.
To start working with this section, please use the quick access toolbar (see the screenshot below):
Screenshot: Dashboard toolbar
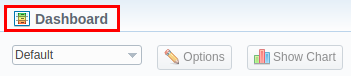
- In the section, you can have several dashboards. To pick a target dashboard, click on the respective field and select a relevant dashboard (for example, Default) from the drop-down list.
- To view the advanced settings, press the Options button on the toolbar.
- You can change the name of the respective dashboard, specify a new name in the Dashboard name field, click Save, and reload the page.
- To copy the dashboard, click Copy and reload the page. Then, you select it in the list of available dashboards.
- Also, you can remove any dashboard. Simply select it, open settings, and click the Delete button.
- To add a relevant chart to the dashboard, click the Show Chart button. Then choose the category of the chart (i.e., Summary report/Orig-Term report/Active Calls) and select the respective chart from the drop-down list. You could add several charts and use the vertical scrolling to browse the dashboard.
| Panel | ||||||
|---|---|---|---|---|---|---|
| ||||||
|

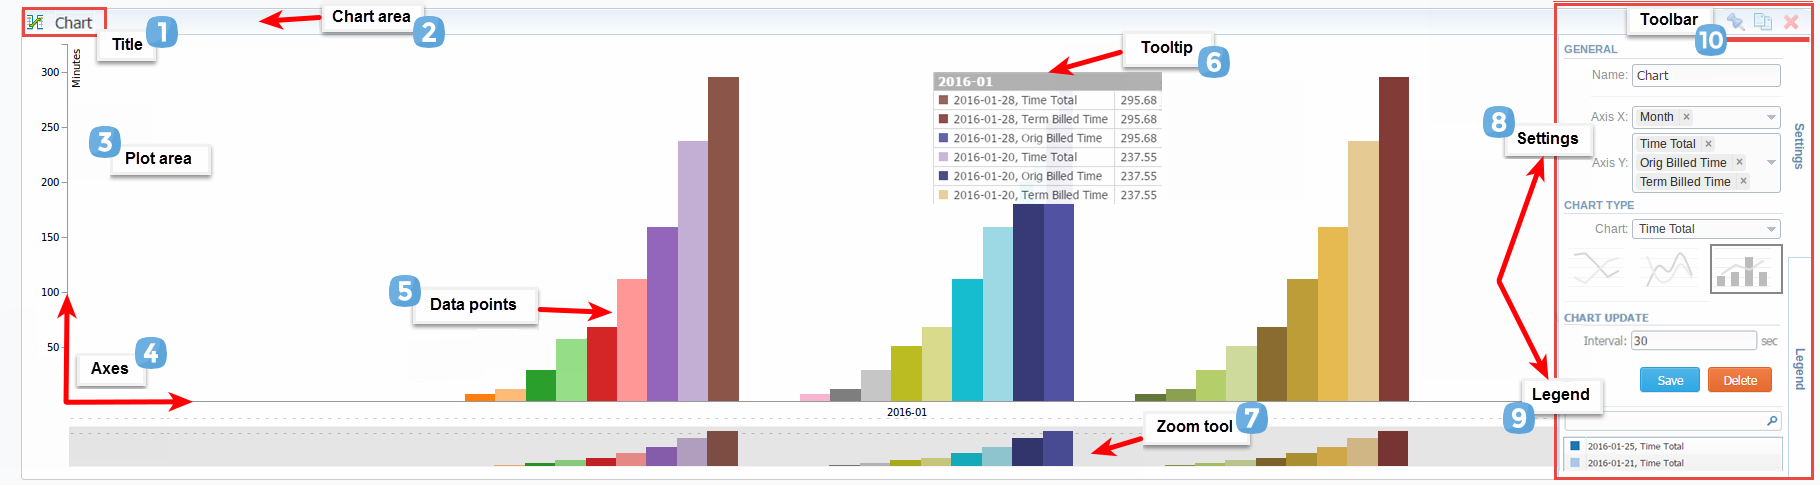
Screenshot: General example of a chart
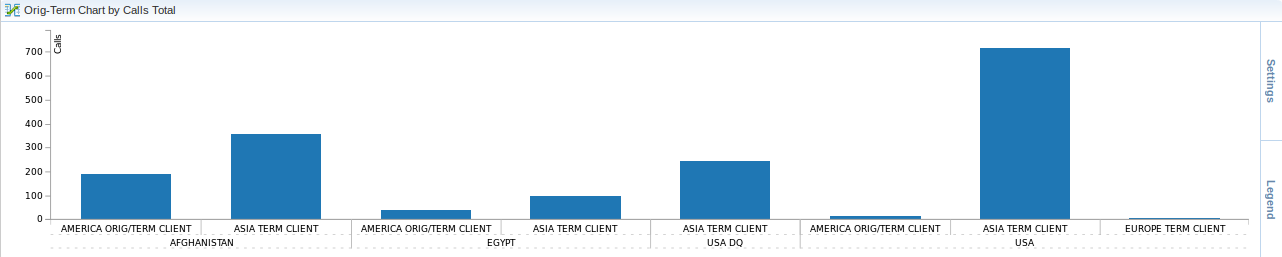
Screenshot: Orig-Term chart
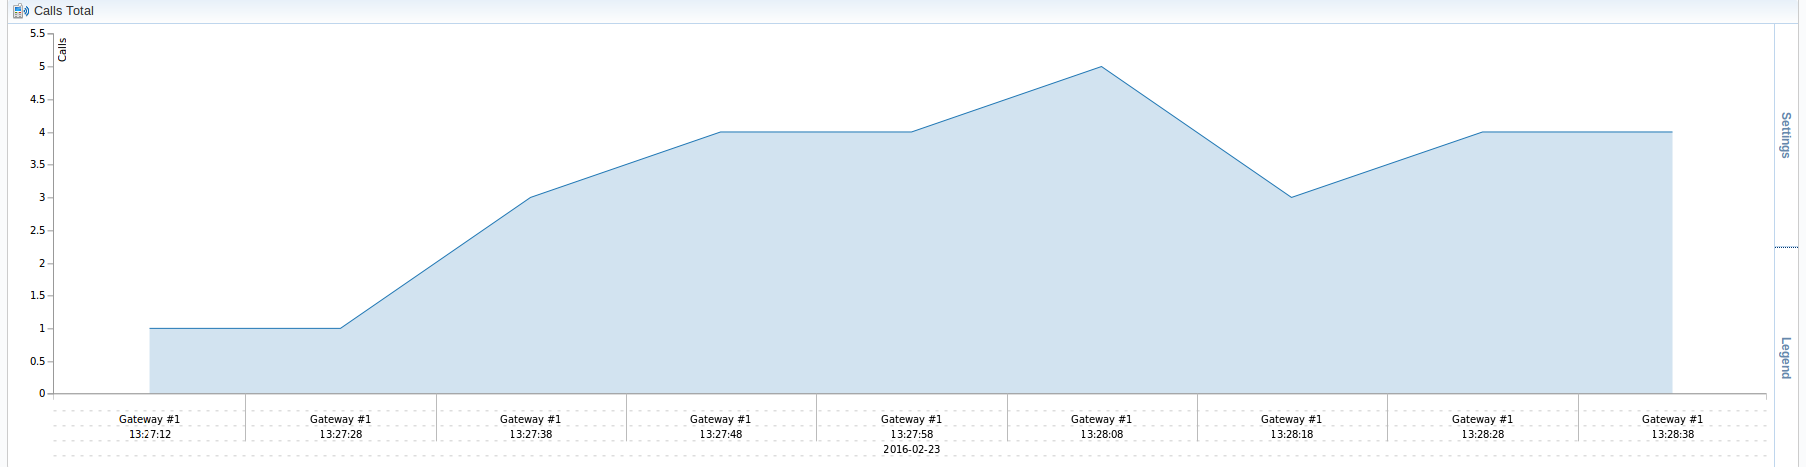
Screenshot: Active calls chart
Knowledge Base Articles
| Content by Label | ||||||||||||||||||
|---|---|---|---|---|---|---|---|---|---|---|---|---|---|---|---|---|---|---|
|
Overview
Content Tools