Docs for all releases
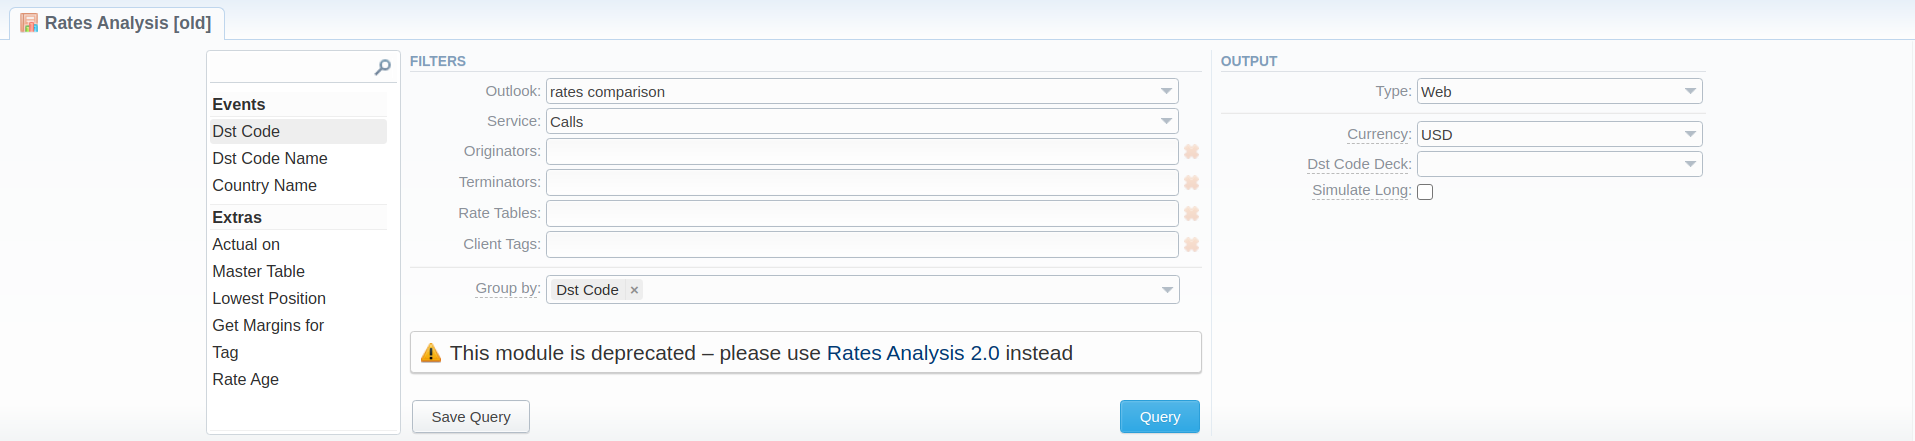
This documentation relates to an earlier version of JeraSoft VCS.
View User Guide 3.26 or visit our current documentation home page.
View User Guide 3.26 or visit our current documentation home page.
In this article
Rates Analysis Form
Rates Analysis is an advanced feature of the JeraSoft Billing Rates Management Module. It allows you to analyze and compare rates within the JeraSoft Billing web interface without the usage of any third-party software.
Screenshot: Rates Analysis section
Creating a New Analysis Report
To analyze and compare different rates, you need to fill in the form with the next parameters:
| Information Block | Field Description | |
|---|---|---|
| Filters | On the Filters menu, select the required parameters for the report. To cancel any filter, click on the delete | |
| Outlook | Choose the form of the rate analysis report for data display. Please note that this field is mandatory and should be filled in to make a report.
| |
| Service | Select a service for rates analysis | |
| Originators | Specify origination clients for analysis | |
| Terminators | Indicate termination clients for analysis | |
| Rate Tables | Define rate tables for analysis | |
| Client Tags | Select clients matching specified tags for analysis | |
| Group by | Select a grouping option from the following list:
This option is intended to simplify grouping, the system will automatically group data in specified columns. | |
Additional Filters | ||
The accessible additional filters are:
| ||
| Events settings | ||
| Dst Code | Specify a code of the needed destination. | |
| Dst Code Name | Define a code name of the desired destination. | |
| Country Name | Enter the name of the respective country. | |
| Extra settings | ||
| Actual on | Define the Effective Date of rates. | |
| Master Table | Specify a rate table that all other rate tables will be compared to.
Please note that this field is active only during rate tables analysis | |
| Lowest Position | Enter the number of the position from the full list of rates. For example, if you are looking for the cheapest destination in several rates, type 1 in this field. Please note that this feature only works with the Master Table option. | |
| Tag | Indicate a tag, which relates to a specified rate table | |
| Get margins for | Define a rate table, from which the respective margins will be taken. It is used to analyze margins. | |
| Rate age | Specify the number of days | |
| Output | This information block contains settings of the report output data. | |
| Type | Choose a format of the report from a drop-down list:
If CSV, Excel XLS or Excel XLSx type has been selected, an additional Send to field will be displayed. In this field, you can specify emails of the clients, to which the current report in the selected format will be sent. | |
| Currency | Specify a currency of the report. All values will be automatically converted to the specified currency in the report. | |
| Code Deck | Select a code deck from a drop-down list. All codes in the following report will be presented according to the specified code deck. | |
Simulate long codes checkbox | Check if a rate table does not have codes, which are presented in other tables for simulating them using shorter codes.
If you check the Simulate long codes checkbox, the system will try to simulate the longest available code with the shorter one. For example, we analyze two rate tables, one of which has code 380, and the other has 380 and 38044 codes. | |

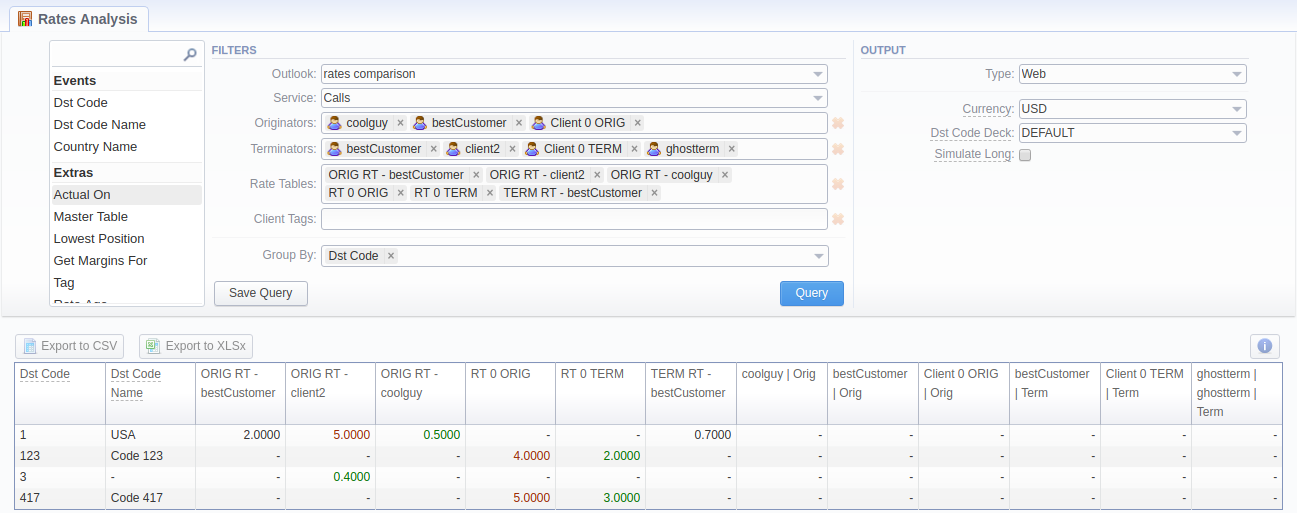
After clicking the Query button, the system will form a list of rates with prices for each destination. The highest rate available for the destination is colored in red, the lowest – in green, and middle rates are colored in black.
Screenshot: Rates Analysis section
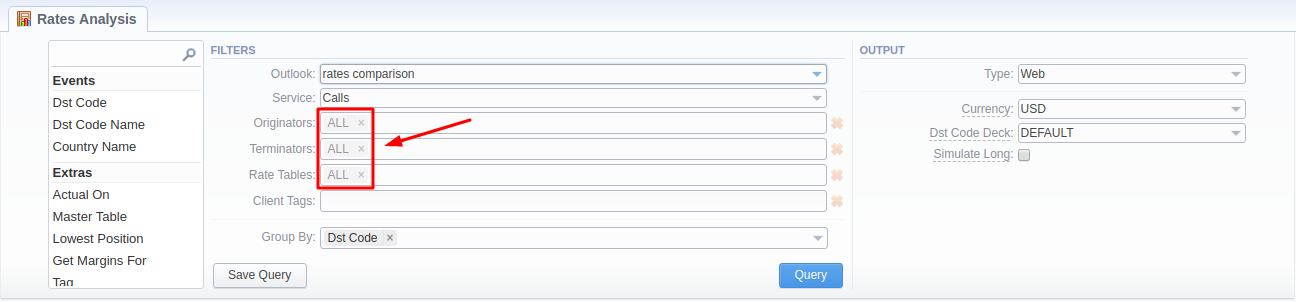
Also, there is a possibility to select all values in the Rates Analysis form for the following fields: Rate tables, Originators, Terminators.
Screenshot: Rates Analysis section
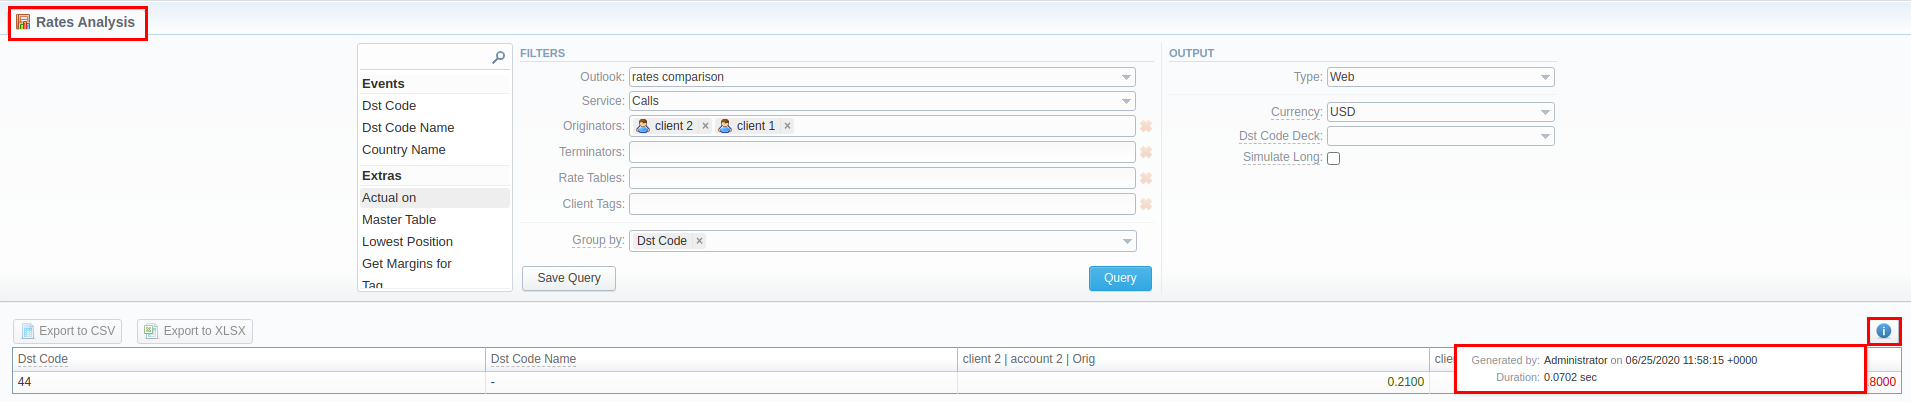
By clicking the Info  icon above the report on the right, the user's name and time/date, when a report was generated, will be displayed in a pop-up window.
Screenshot: Info icon
![]()
Creating a New Template
Also, you can create a template and save specified parameters by clicking the Save Query button. A pop-up window with settings will appear, where you need to fill out the following form:
Screenshot: New Template form
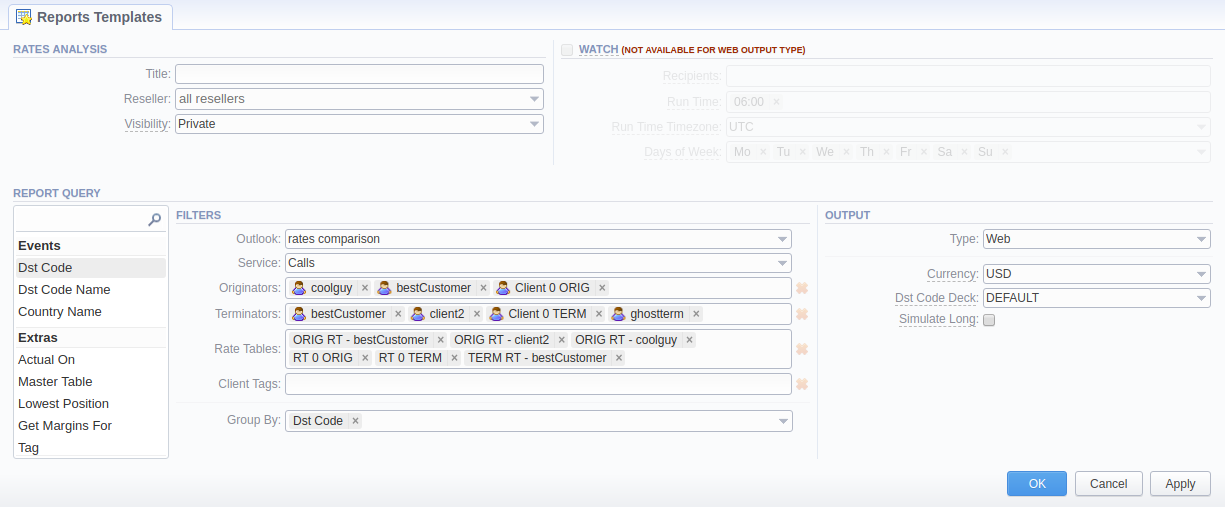
| Section | Description | |
|---|---|---|
| Rates Analysis | Here you can specify parameters for the template that will be used while running reports | |
| Title | Specify a name of the template | |
| Reseller | Indicate a Reseller for the report template | |
| Visibility | It allows controlling the visibility of respective reports templates. You can set up whether you want to keep templates private or leave them visible for users under a specified Reseller. To enable this option, select one parameter from the drop-down list:
| |
| Watch | This tool allows to generate the report automatically at the appropriate time and send the results to the list of emails.
Please note that this tool is not available for Web output type, only for CSV/Excel XLS/Excel XLSx | |
| Recipients | Specify recipients. You can indicate your own email, or other users of the system, or even 3rd parties | |
| Run Time | Indicate an appropriate time to generate a report automatically, it could be several times, for example, 10:00, 12:00, 18:00 | |
| Days of Week | Indicate days of the week to generate a report automatically. For example, you can run a report only on Monday or each day of the week. | |
| Report Query | Here you need to check filters and the output type. These values will be pre-selected by default according to the formed rate analysis query. | |
After a template has been created, a new Load Query button will be added to the section. By clicking it, you can select report settings to be filled in from a list of templates for rates analysis.
Export generated report
You can export report data either in .xls file or .csv that would contain currently presented data. Click the Export to XLSx or Export to CSV button to download a file of the respective format.
Sharing a Report
Each time you get a report output, the system generates a unique link in the format of "/view?id=<uniq-string>". It allows sharing data between the users, even if they belong to different resellers (the feature works similarly to Share by Link in Google Drive).
The link refers to the report data valid for a specific moment.
Example: When you send a link to a report, you ensure the recipient would see the same data as you do. If you change data in the system (for example, perform rerating), the previously copied link to the report will display data valid for the moment of generation (even though the actual data is now different).
You can also view the additional information about the generated report by hovering over the Info ![]() icon, which is located under the Output section:
icon, which is located under the Output section:
Title | Description |
|---|---|
| Generated by | Indicates the Role of the user who generated a report and specifies a generation time |
| Duration | Time spent to generate a report |
Screenshot: Rates Analysis Info icon
Overview
Content Tools