Docs for all releases
This documentation relates to an earlier version of JeraSoft VCS.
View User Guide 3.26 or visit our current documentation home page.
View User Guide 3.26 or visit our current documentation home page.
System Status displays all currently launched system services, system load info and current system database sessions of the main server, divided into two information blocks: Localhost and Master Database Sessions. In addition, this section displays the status of Redundancy and Reporting servers (see screenshot below). Section structure is a follows:
Screenshot: System Status section
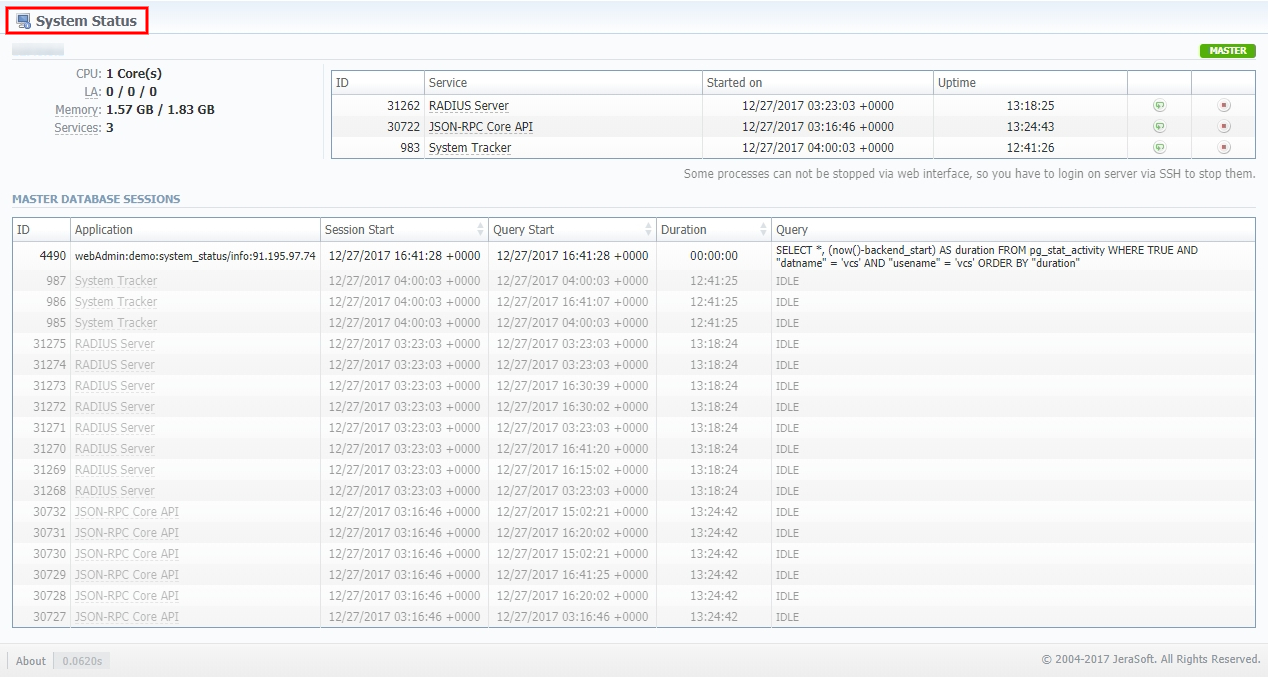
| Information Block | Column | Description |
|---|---|---|
| Localhost | CPU | Number of Central Processing Unit cores |
| LA | System Load Average | |
| Memory | Amount of Used and Total Memory | |
| Services | Number of currently running services | |
| ID | System service identification number | |
| Service | Name of the system service | |
| Started on | Start date and time of the service | |
| Uptime | Current uptime of the service | |
| Master Database Sessions | ID | Database session ID |
| Application | Name of the application | |
| Session Start | Session start date and time | |
| Query Start | Query start date and time | |
| Duration | Session duration | |
| Query | Description of the query |
The section allows a user to start, stop, and restart services manually with the help of certain icons.
| Icon | Description | |
|---|---|---|
| Allows to start any service that is not currently running | |
| Allows to restart a service that is currently running | |
| Allows to stop a service | |


![]() Attention
Attention
Note that you cannot stop some processes via web interface. To do so, you need to login on a server via SSH to stop them.
Overview
Content Tools