Docs for all releases
This documentation relates to an earlier version of JeraSoft VCS.
View User Guide 3.26 or visit our current documentation home page.
View User Guide 3.26 or visit our current documentation home page.
In this article
Section overview
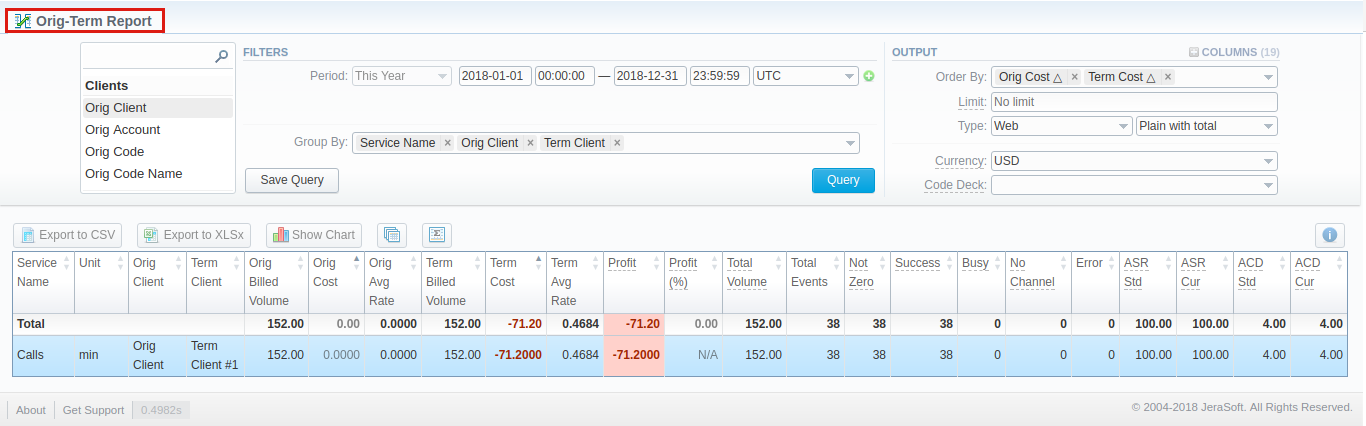
This section is designed to provide a user with a possibility to generate a report and trace all call routes from a Client to any Provider with orig-term cost and profit. Here you can create a report based on an existing template or generate a new one. Also, you can get the information sorted by clients, events, profit, etc.
Screenshot: Orig-Term Report query form

Creating a New Orig-Term Report
To create a new summary report, you need to fill in the following parameters in the form and click the Query button:
| Information Block | Field Description | |
|---|---|---|
| Filters | On the Filters menu, select the required parameters for the report. To cancel any filter, click the delete | |
| Period (1) | Specify the time interval for the report and a timezone. Please note that the Period field is mandatory. | |
| Period 2 | Accessible when you enable the Compare Period option by clicking on the plus When you select one of the Time parameters for Group by, the end date of the Period 2 will be set automatically to make equal intervals of Period 1 and Period 2. | |
| Group by | There are the following accessible options to group the data in reports:
Please note, the Group by field is mandatory, it couldn't be empty in order to generate the report. | |
Additional Filters | ||
There are the following accessible additional filters:
| ||
| Clients Settings | ||
| Orig Client | Define an origination client for the report | |
| Orig Account | Enter an origination account for the report | |
| Orig Code | Specify an origination code for the report | |
| Orig Code Name | Indicate an origination code name | |
| Orig Serial | Define an origination serial | |
| Orig Owner | Define an origination Reseller for the report | |
| Orig Client's Tags | Determine tags that belong to an origination client | |
| Orig Account's Tags | Specify tags determined for an origination account | |
| Term Client | Define a termination client for the report | |
| Term Account | Enter a termination account for the report | |
| Term Code Name | Indicate a termination code name | |
| Term Owner | Define a Reseller for the report | |
| Term Client's Tags | Determine tags that belong to a termination client | |
| Term Account's Tags | Specify tags determined for a termination account | |
| Term Code | Specify a termination code for the report | |
| Events Settings | ||
| Total | Enter the range of total events | |
| Profit | Enter the range of the revenue you would like to display | |
| Events Not Zero | Define the range of events, that have duration greater than 0 | |
| ASR Current | Specify the range of ASR Cur for events you would like to display | |
| ACD Current | Specify the range of ACD Cur for events you would like to display | |
| Volume, Total | Enter the range of total volume of services | |
| Extra Settings | ||
| Orig Time Profile | Select an orig time profile that will be used as filter criteria | |
| Term Time Profile | Specify a term time profile that will be used as filter criteria | |
| Service Name | Determine the name of service for the report | |
| Output | This form contains settings of the output data of the report. Click the plus | |
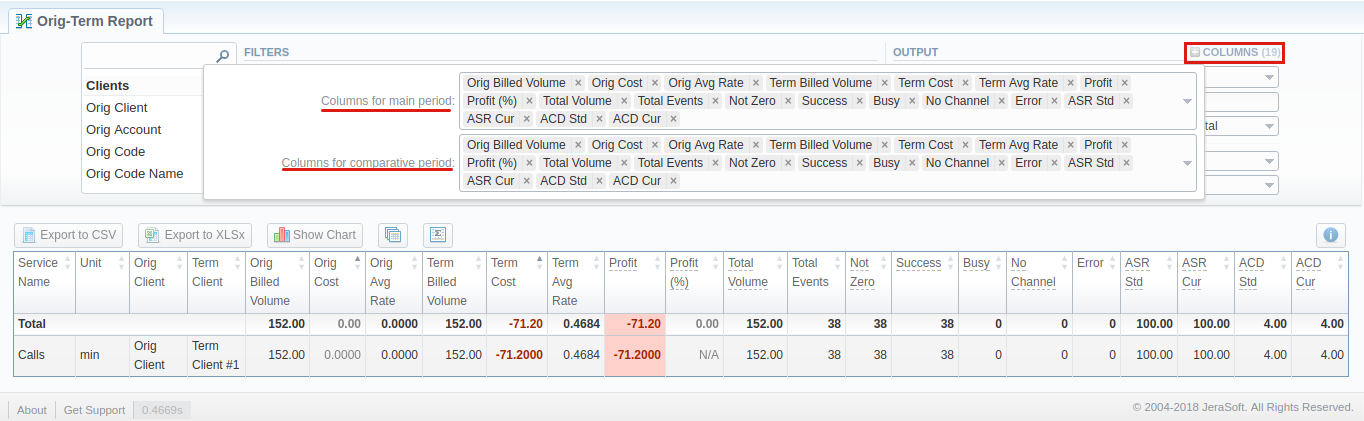
| Accessible columns in the report | ||
Columns for the main period are: ASR Std, ASR Cur, ACD Std, ACD Cur, Total Volume, Error, Profit, Profit (%), Orig Billed Volume, Orig Cost, Orig Avg Rate, Term Billed Volume, Term Cost, Term Avg Rate, Total Events, Not Zero, Busy, No Channel, Success. Columns for the comparative period are the same as for the main period. Moreover, all parameters could be selected expressed in percentage. | ||
Orig | Origination information:
| |
| Term | Termination information:
| |
| Profit |
| |
| Total Volume | Total volume of services | |
| ASR | Average successful rate (successful events percentage):
| |
| ACD | Average call duration:
| |
| Events | Quantity of events in a database
| |
| Other output settings | ||
| Order by | Select parameters to sort already grouped data in columns. Here you can sort data from highest to lowest values (or vice versa) and select different values. | |
| Type | Choose a format of the report from a drop-down list: Web/CSV/Excel XLS/Excel XLSx Also, select a look of a table view next to the Type field:
Please note, that the Grouped type of table view is available only for Excel XLSx and Web formats; it doesn't work with CSV. | |
| Limit | Determine the number of rows that will be visible in the report. It is useful for displaying some top positions by the chosen parameter. It is available only for plain and plain with total types of the report. | |
| Send to | You can send generated reports via email. Also, it is possible to specify several emails.
This feature is available only for CSV/Excel XLS/Excel XLSx formats of the report; it doesn't work with Web. | |
| Currency | Specify a currency for the report. All values will be automatically converted to the specified currency in the report. | |
| Code Deck | Select a code deck from a drop-down list. All codes in the following report will be presented according to the specified code deck. | |

A generated orig-term report is demonstrated on a screenshot below:
Screenshot: Orig-Term Report section
If the data is grouped in the report, it will be shown initially collapsed. To expand or collapse data in your report, click the ![]() plus or
plus or  minus icons. To expand all data in the report, please click Ctrl and
 ![]() .
.
![]() Warning
Warning
Please note, the system shows rounded values in the reports. However, while calculating, the system takes an exact value. Hence, the procedure of the rounding is as follows:
- the system rounds currency values according to the settings of a respective currency
- all types of events (e.g., not zero, success, busy, as well as total quantity) are not rounded
- such parameters as Orig Avg Rate, Term Avg Rate, Profit, Term Cost are rounded to the nearest ten-thousandth. For example, 3.879256 to 3.8793
- others are rounded to the nearest hundredth. For example, 4.8763 to 4.88
Simple scheme: how to generate an orig-term report
An easy way to generate a simple orig-term report is:
- Select the desired parameters for the report on the Filters menu.
- Enter the period.
- Select some parameters in the Group by field, for example, Orig Client, Service Name.
- Select Columns in the Output form, for example, ASR Std, ASR Cur, ACD Std, ACD Cur, Success, Error, Profit (%).
- Specify the Type field or leave its default settings (Web/Grouped)
- Specify the currency and choose the code deck (if applicable).
- Click the Query button.
![]() Tip
Tip
- If you want to sort already grouped data in columns, select the respective parameters in the Order by field. Also, you can sort from highest to lowest values (or vice versa).
- Please note, the Order by option is active when the Type of the Output form is Plain or Plain with Total. When it is Grouped, the data is only sorting by values specified in the Group by field.
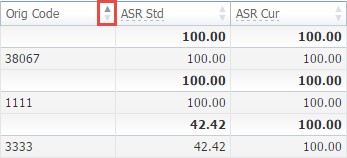
Also, you can sort data in a report manually using special arrows ![]() next to the name of the respective columns.
next to the name of the respective columns.
Screenshot: Orig-Term Report
Creating Reports Templates
Also, you can create a template for reports and save specified parameters by clicking the Save Query button. A pop-up window with settings will appear and you will need to fill out the following form:
Screenshot: New Template creation form
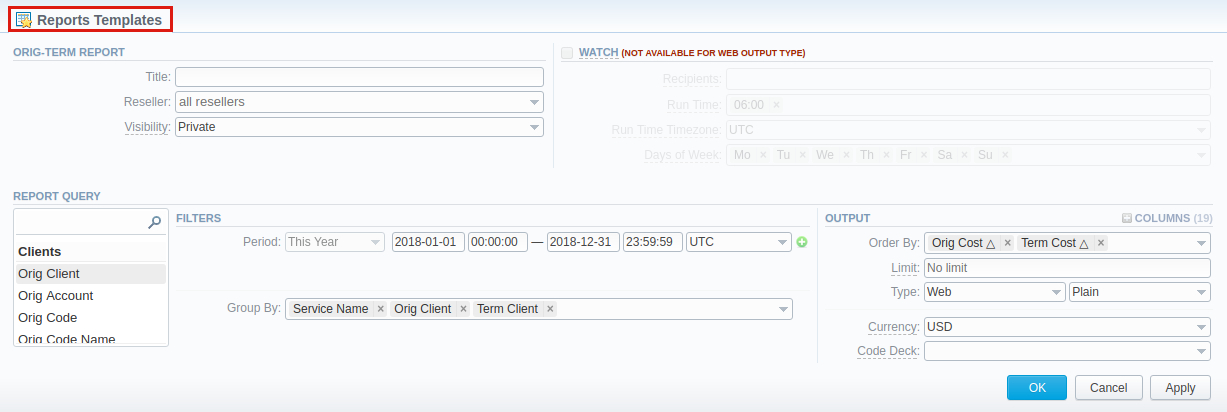
To find more details about templates, please refer to the Report Templates article in our User Guide.
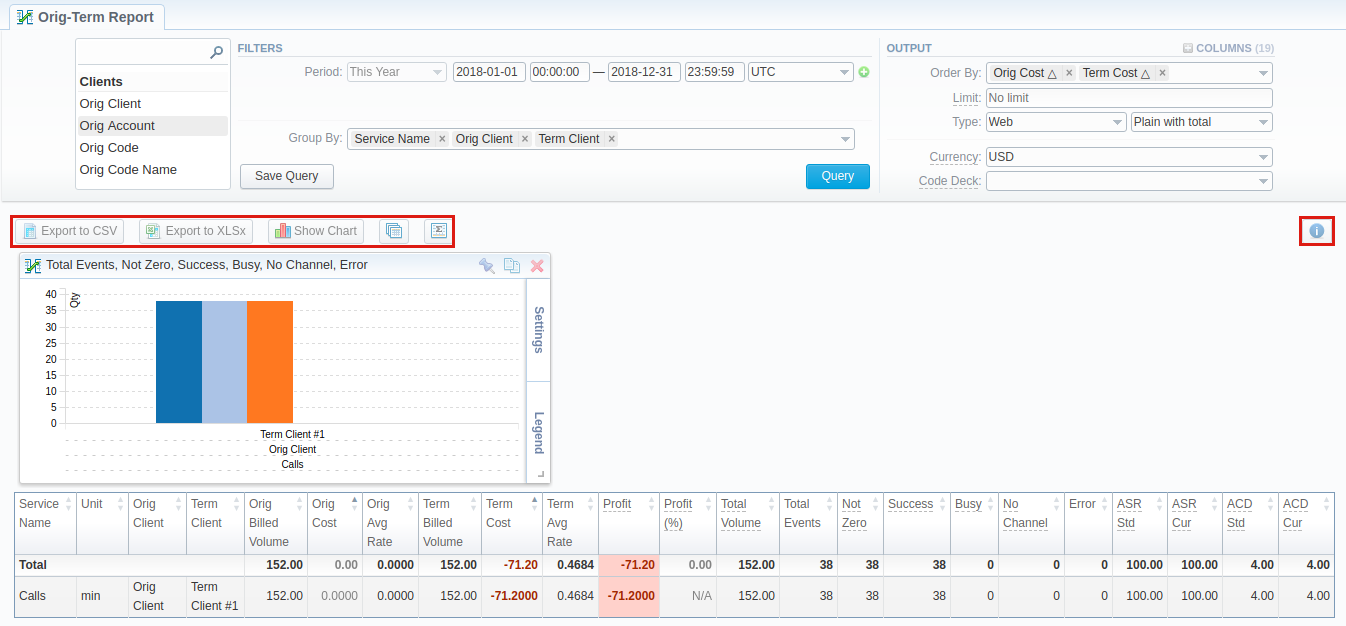
Orig-Term Report buttons: reports, export, chart.
You can export data to a CSV or XLSx file, which contains only currently displayed data, no automatic request to update data while exporting. Also, it is possible to create charts for illustrating crucial information easily. And you can generate a report using the same criteria in the Summary report and the xDRs list sections.
1. To download a report in .csv, click the Export to CSV  button on the toolbar.
![]() Attention
Attention
Please note, this button will be visible only when the Type of the output is Plain. For the Grouped output type it is not available.
2. To download an .xlsx file, click the Export to XLSx  button on the toolbar.
3. To create a visual chart, click the Show Chart  button on the toolbar. There is more information available on this topic in the article "How to create a statistic chart?" in our Knowledge Base.
4. You can generate a detailed report using the same criteria in the xDRs list section by clicking the xDRs list  icon on the toolbar.
5. And it is possible to generate a report using the same criteria in the Summary report section by clicking the Summary  icon on the toolbar.
6. You can check an actual date interval of the report by clicking the Info  icon and it could be different from the Interval specified above if there is no data for the period.
Screenshot: Orig-Term Report section/ chart
Side-by-side report
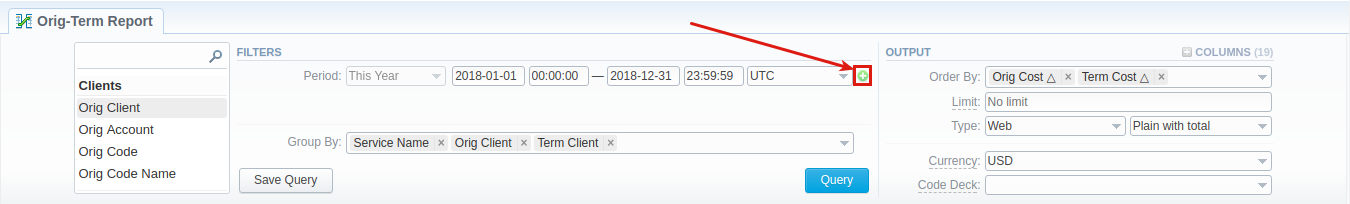
This tool allows building a report with side-by-side sub-reports. Use it to run a comparative analysis on the same page. It's helpful for reviewing multiple parameters, totals, and compare results at different time intervals. The Compare Period option is designed to create a report that shows two sub-reports side-by-side.
To enable this option, click the plus  icon next to the Period field and specify both intervals (Period 1/Period 2) for the report.
Screenshot: Orig-Term Report query form
Afterwards, choose columns for the main and comparative period in the report output form. When all required parameters are specified, click the Query button.
To remove this filter, please click the delete  icon.
icon.
You can modify a comparative mode by changing periods and columns. For example, to compare how different the cost total of the two periods is in percentage terms. To do this, choose the Cost Total (%) value from the Columns. Therefore, the final report splits Cost Total (%) into separate columns (see screenshot below).
Screenshot: Orig-Term Report example
Knowledge Base Articles
Overview
Content Tools