Docs for all releases
Page History
...
| Information Block | Field Description | |||||||||||
|---|---|---|---|---|---|---|---|---|---|---|---|---|
| Filters | On the Filters menu, select the required parameters for the report. To cancel any filter, click on the delete | |||||||||||
| Service | Select a service for rates analysis. Default is calls | |||||||||||
| Dst Code | Specify a code of the needed destination | |||||||||||
| Dst Code Name | Define a code name of the desired destination | |||||||||||
| Clients | Indicate termination clients for analysis | |||||||||||
| Accounts | Indicate termination accounts for analysis Select clients matching specified tags for analysis | |||||||||||
| Rate Table | Define rate tables for analysis Select a grouping option from the following list: This option is intended to simplify grouping, the system will automatically group data in specified columns. | |||||||||||
Additional Filters | ||||||||||||
Master Source | ||||||||||||
| Master - Table | Specify a rate table that all other rates will be compared to | |||||||||||
| Master - Client | Specify an origination client that all other rates will be compared to | |||||||||||
| Master - Account | Specify an origination account that all other rates will be compared to | |||||||||||
| Rate Filters | ||||||||||||
| Dst Code Country | Enter the name of the respective country | |||||||||||
| Rate Tags | Indicate a tag, which relates to specific rates | |||||||||||
| Extras | ||||||||||||
| Actual on | Define the date, when the rates should be effective on
| |||||||||||
| Volume Interval | Specify the number of days of statistics that would be taken for analysis | |||||||||||
| Output | This information block contains settings of the report output data. Click the plus | |||||||||||
| Accessible columns in the report | ||||||||||||
The list of additional columns include:
| ||||||||||||
| Order by | Select parameters to sort already grouped data in columns. Here you can sort data from highest to lowest values (or vice versa) and select different values | |||||||||||
| Type | Choose a format of the report from a drop-down list:
If CSV , Excel XLS or Excel XLSx type has been selected, an additional Send to field will be displayed. In this field, you can specify emails of the clients, to which the current report in the selected format will be sent. | |||||||||||
| Currency | Specify a the currency of the report. All values will be automatically converted to the specified currency in the report. | |||||||||||
| Dst Code Deck | Select a code deck from a drop-down list. All codes in the following report will be presented according to the specified code deck | Simulate long codes checkbox | Check if a rate table does not have codes, which are presented in other tables for simulating them using shorter codes.
| |||||||||
Group by | Select a grouping option from the following list:
This option is intended to simplify grouping, the system will automatically group data in specified columns. If certain termination entities will have different prices within the same Code Name, the rows will be displayed separately. | |||||||||||

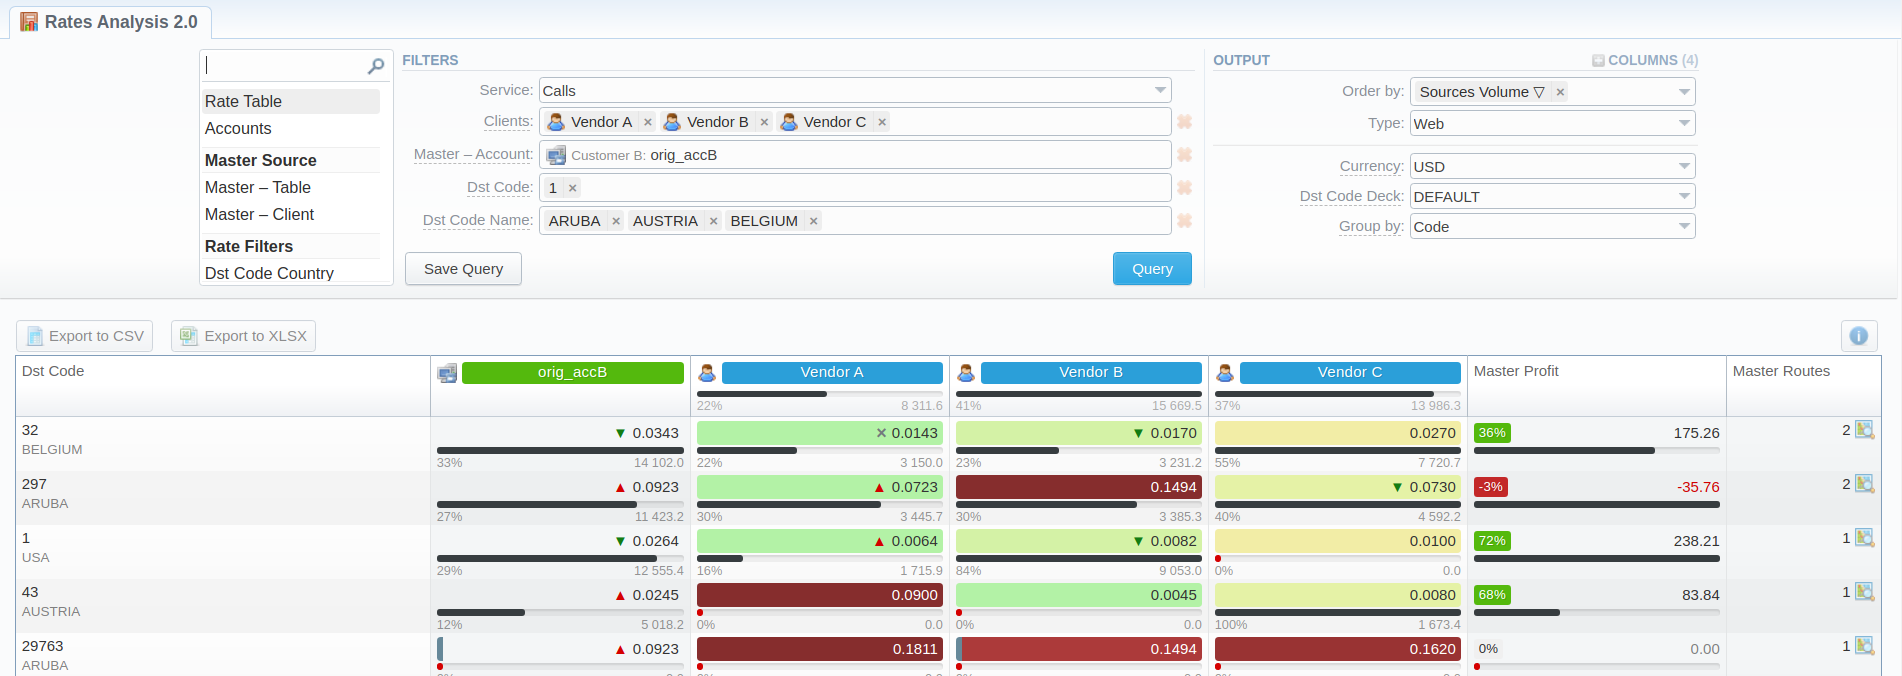
After clicking the Query button button, the system will form a list of rates with prices for each destination. The highest rate available for the destination is colored in red, the lowest – in green, and middle rates are colored in blackThe appeal of rates is visualized as a heat map for convenience. The darker the red - the least profitable, the brighter the green - the more, respectively.
Screenshot: Rates Analysis section output
By clicking the Info  icon above the report on the right, the user's name and time/date, when a report was generated, will be displayed in a pop-up window.
...
Overview
Content Tools