Docs for all releases
Page History
...
| Information block | Field Description | |||||||||
|---|---|---|---|---|---|---|---|---|---|---|
| Filters | On the Filters menu, select the required parameters for the report. To cancel any filter, click on the delete You can start a quick search by typing filters' names in the field at the top of a drop-down menu with filters. | |||||||||
| Period (1) | Specify the time interval for the report and a timezone. Please note that the Period field is mandatory. | |||||||||
| Period 2 | Accessible when you enable the Compare Period option by clicking on the plus
| |||||||||
| Group by | Select from the list of the following accessible options to group the data in reports:
| |||||||||
Additional Filters | ||||||||||
The accessible additional filters are:
| ||||||||||
| Client Type | Select a client's type for the report: Client, Reseller, Calling Card or Call Shop | |||||||||
| Client | Define a client for the report | |||||||||
| Account | Enter an account for the report | |||||||||
| Client/Account Tags | Define a client's or account's tag | |||||||||
| Cards Serial | Indicate cards serial for the report | |||||||||
| Package | Enter a package for the report | |||||||||
| Code | Specify a code of the needed destination | |||||||||
| Code Name | Specify a code name of the desired destination | |||||||||
| Cost Total | Enter the range of total call cost | |||||||||
| Origin | Indicate an origin - origination or termination of the event | |||||||||
| Result Code | Define a result code as a filtering parameter | |||||||||
| Gateway | Specify a gateway | |||||||||
| Time Profile | Specify the time profile of the event | |||||||||
| Owner | Indicate the owner | |||||||||
| Total Volume | Enter the range of total duration | |||||||||
| Total Records | Enter the range of total records | |||||||||
| Not Zero Records | Define the range of records that have a duration equal to or more than 1 unit | |||||||||
| ASR Current | Specify the range of ASR Cur for records you would like to display | |||||||||
| ACD Current | Specify the range of ACD Cur for records you would like to display | |||||||||
| Service | Determine the name of service for the report | |||||||||
| ||||||||||
| Output | This form contains settings of the report output data. Click the plus | |||||||||
| Accessible columns in the report | ||||||||||
The list of additional columns include: Columns for the main period: Cost Total, Setup Fee Cost, Average Rate, Package Credit, Total Volume, Billed Volume, Package Volume, Total Events, Not Zero, Success, Busy, No Channel, Error, ASR Std, ASR Cur, ACD Srd, ACD Cur, PDD Avg, SCD Avg, xDRs List, Taxes Total, Additive Cost. Columns for the comparative period are the same as for the main period. Moreover, all parameters could be selectedexpressed in percentage. | ||||||||||
Rate | Avg. Rate - an average cost calculated | |||||||||
| Totals |
| |||||||||
| Statistics | ASR - average success rate (successful records percentage)
ACD - average call duration in minutes
PDD Avg - average post-dial delay in seconds SCD Avg - average session connect delay in seconds | |||||||||
xDRs List - list of detailed records statistics | ||||||||||
| Other output settings | ||||||||||
| Order by | Select parameters to sort already grouped data in columns. Here you can sort data from highest to lowest values (or vice versa) and select different values. | |||||||||
| Type | Choose a format of the report from a drop-down list: Web/CSV/Excel XLS/Excel XLSx Also, select a look of a table view next to the Type field:
| |||||||||
| Limit | Determine the number of rows that will be visible in the report. It is useful for displaying some top positions by the chosen parameter. It is available only for the Plain report type. | |||||||||
| Send to | You can send generated reports via email. Also, it is possible to specify several emails.
| |||||||||
| Currency | Specify a currency of the report. All values will be automatically converted to the specified currency in the report. | |||||||||
| Code Deck | Select a code deck from a drop-down list. All codes in the following report will be presented according to the specified code deck. | |||||||||


...
Screenshot: Summary Report section
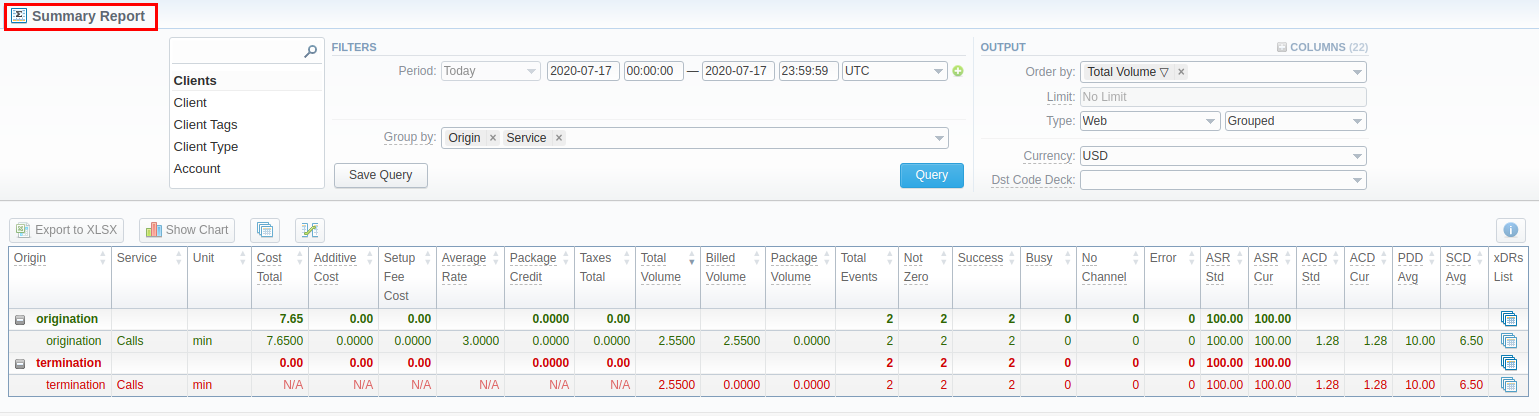
If the data in the report is grouped, it will be shown initially collapsed. To expand or collapse data in your report, click the ![]() plus or
plus or  minus icons. To expand all data in the report, please click Ctrl + the
 ![]() icon.
icon.
...
| Panel | ||||||||
|---|---|---|---|---|---|---|---|---|
| ||||||||
To find more details about templates, please refer to the Report Templates article in our User Guide. |
...
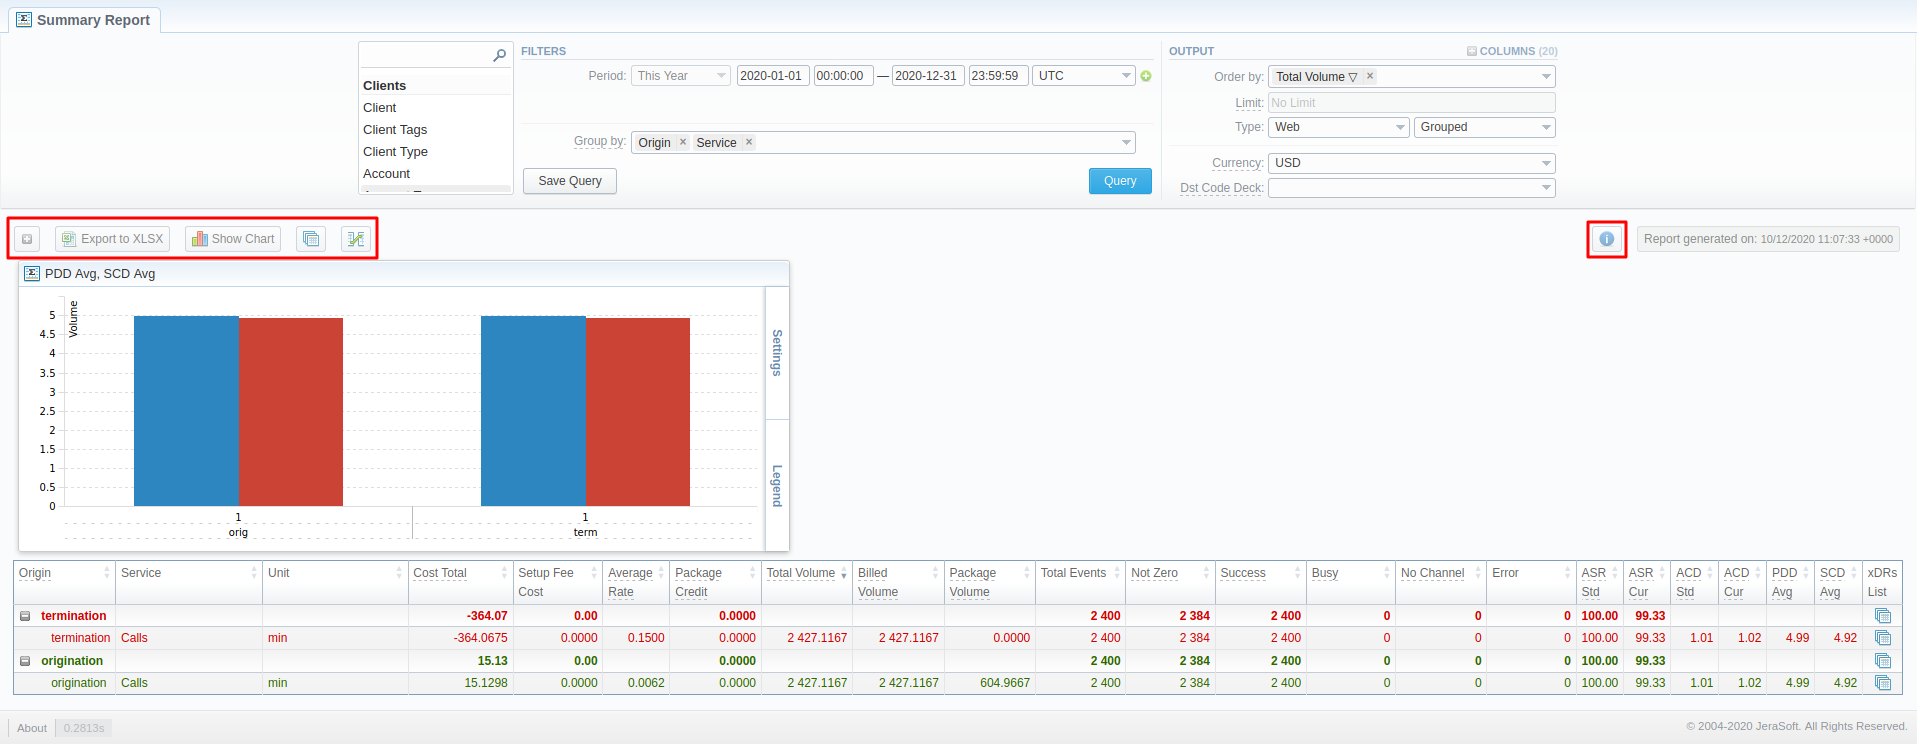
You can export data to a CSV or XLSx file, which contains only currently displayed data, with no automatic request to update data while exporting. Also, it is possible to create charts for illustrating crucial information easily. You can generate a report using the same criteria in the Orig-Term report and the xDRs list sections.
1. To expand/collapse all the data for the Grouped output, click on the ![]() icon above the report.
icon above the report.
2. To . To download a report in .csv, click on the Export to CSV button above the report.
| Panel | ||||||
|---|---|---|---|---|---|---|
| ||||||
Please note, this button will be visible only when the Type of the output is Plain. For the Grouped output type it is not available. |
23. To download a .xlsx report file, click the Export to XLSx  button above the report.
34. To create a visual chart, click the Show Chart  button above the report. There is more information available on this topic in the article How to create a statistic chart? in our Knowledge Base.
45. You can generate a detailed report using the same criteria in the xDRs list section by clicking the xDRs list  icon above the report.
| Panel | ||||||||
|---|---|---|---|---|---|---|---|---|
| ||||||||
When you make a report based on two periods, two xDRs list
When you make a report and filter data by Client/Client Tags/Account/Code/Code Name/Owner parameters, two Orig-Term icons
|


56. It is possible to generate a report using the same criteria in the Orig-Term section by clicking the Orig-Term  icon on the toolbar.
67. You can check an actual date interval by clicking on the Info  icon. The displayed data could be different from the Interval specified above if there is no data for the period.
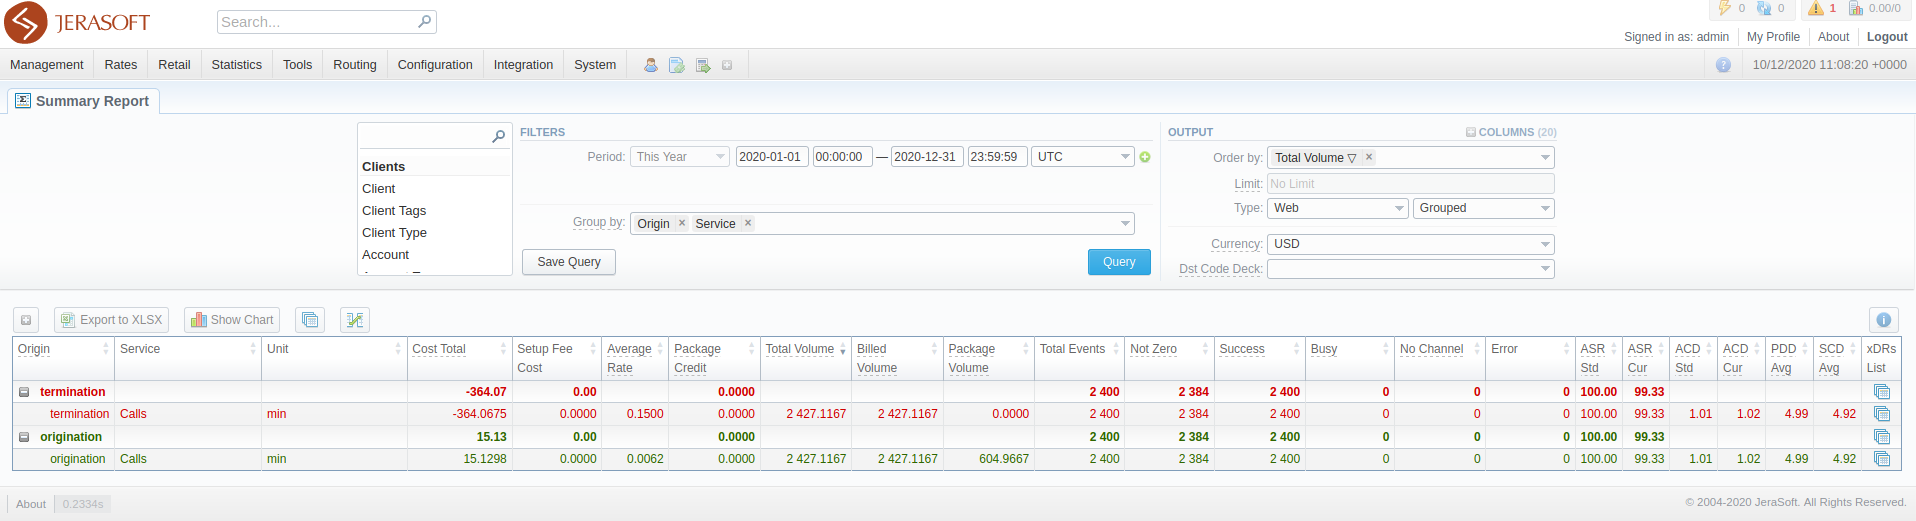
Screenshot: Summary Report section

Side-by-side report
...
Overview
Content Tools