Docs for all releases
Page History
...
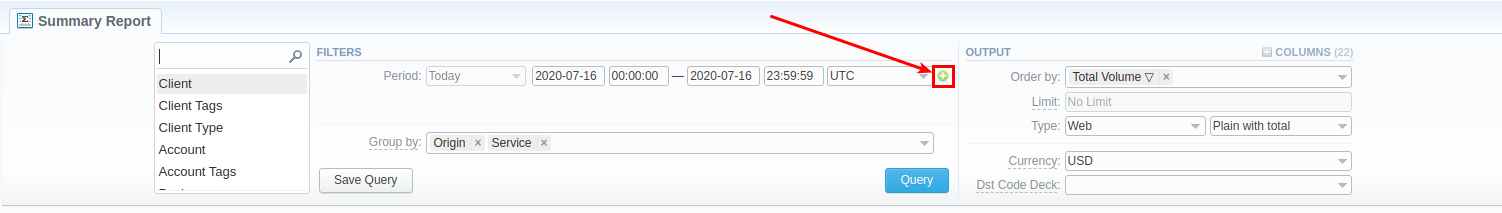
Screenshot: Summary Report query form

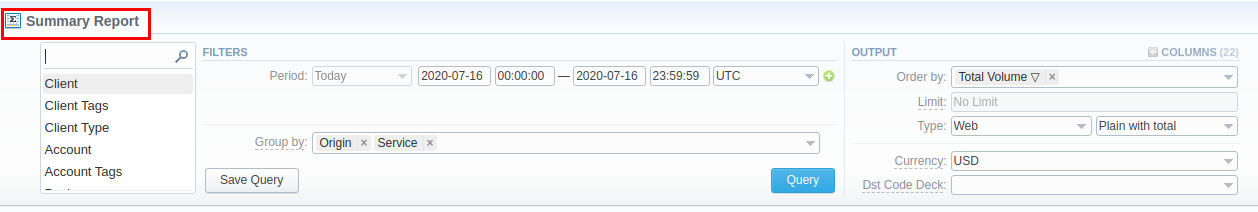
Creating a New Summary Report
...
| Information block | Field Description | |||||||||
|---|---|---|---|---|---|---|---|---|---|---|
| Filters | On the Filters menu, select the required parameters for the report. To cancel any filter, click on the delete You can start a quick search by typing filters' names in the field at the top of a drop-down menu with filters. | |||||||||
| Period (1) | Specify the time interval for the report and a timezone. Please note that the Period field is mandatory. | |||||||||
| Period 2 | Accessible when you enable the Compare Period option by clicking on the plus
| |||||||||
| Group by | Select from the list of the following accessible options to group the data in reports:
| |||||||||
Additional Filters | ||||||||||
The accessible additional filters are:
| Group by |
| Currency, Rate, Additive Rate
| Gateway, Time Profile|||||||
| Panel | ||||||||||
| ||||||||||

| Note | ||
|---|---|---|
| ||
if you select the current month compare to previous |
Additional Filters
The accessible additional filters are:
- Clients: Client Tags, Client Type, Client, Account, Account Tags, Cards Serial, Package.
- Events: Code, Code Name, Cost Total, Origin, Result Code, Gateway.
- Extras: Owner, Total Volume, Total records, Not Zero Records, ASR Current, ACD Current, Service Name.
This form contains settings of the report output data.
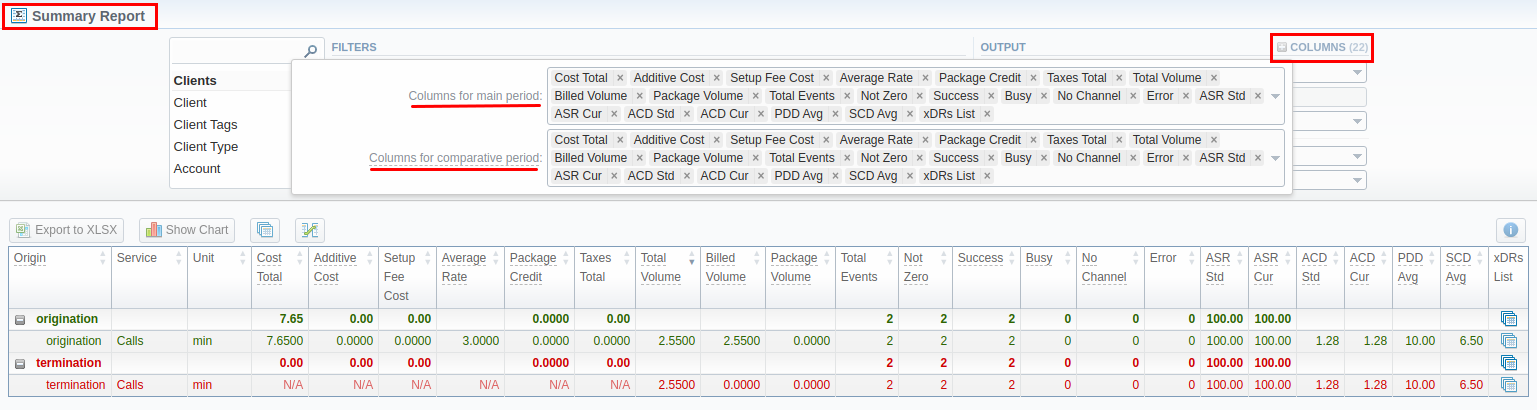
Click the plus ![]() icon next to Columns and select the required columns to add them to the Output information block. Also, you can cancel any chosen item.
icon next to Columns and select the required columns to add them to the Output information block. Also, you can cancel any chosen item.
The list of additional columns include:
Columns for the main period:
Cost Total, Average Rate, Package Credit, Total Volume, Billed Volume, Package Volume, Total Records, Not Zero Records, Success Records, Busy Records, No Channel Records, Error Records, ASR Std, ASR Cur, ACD Srd, ACD Cur, PDD Avg, SCD Avg, xDRs List.
- Gateway.
- Extras: Owner, Total Volume, Total records, Not Zero Records, ASR Current, ACD Current, Service.
This form contains settings of the report output data.
Click the plus ![]() icon next to Columns and select the required columns to add them to the Output information block. Also, you can cancel any chosen item.
icon next to Columns and select the required columns to add them to the Output information block. Also, you can cancel any chosen item.
The list of additional columns include:
Columns for the main period:
Cost Total, Setup Fee Cost, Average Rate, Package Credit, Total Volume, Billed Volume, Package Volume, Total Events, Not Zero, Success, Busy, No Channel, Error, ASR Std, ASR Cur, ACD Srd, ACD Cur, PDD Avg, SCD Avg, xDRs List, Taxes Total, Additive Cost.
Columns for the comparative period are the same as for the main period. Moreover, all parameters could be selectedexpressed in percentage.
Rate
Avg. Rate - an average cost calculated
- Cost Total - the full price of all services including additional services
- Total Volume - a whole volume of the events in units (specified in the Services settings → "Reports" field)
- Billed Volume - a whole billed volume of events. It could differ from the total volume due to the rates settings, for example, grace volume, min volume, and interval.
- Package Volume - a volume within a respective package that is billed according to the package limits
- Package Credit - a volume of credit that has been charged within the respective package
- Total Events - the entire quantity of events
- Not Zero Records - the number of records that have the volume equal to or more than 1
- Success Records - the number of records that have a duration equal to or more than 1 and a successful end code, records with Q.931 disconnect cause 16 or 31
- Busy Records - busy records quantity with Q.931 disconnect cause 17
- No Channel Records - no circuit/channel available, records quantity with Q.931 disconnect cause 34
ASR - average success rate (successful records percentage)
- Std - the value calculated based on the records with "success" status divided by the total number of records minus all records with “no channel available” status
- Cur - the value calculated based on the records with volume > 0 divided by the total number of records
ACD - average call duration in minutes
- Std - the sum of all records duration divided by the number of records with "success" status
- Cur - the sum of all records duration divided by the number of records with duration > 0
PDD Avg - average post-dial delay in seconds
SCD Avg - average session connect delay in seconds
ExtrasxDRs List - list of detailed records statistics
Select parameters to sort already grouped data in columns. Here you can sort data from highest to lowest values (or vice versa) and select different values.
Choose a format of the report from a drop-down list: Web/CSV/Excel XLS/Excel XLSx
Also, select a look of a table view next to the Type field:
- Plain with total - a simple table view with an additional row with calculated totals
- Plain - a simple table view
- Grouped - a table view with grouped data and possibility to collapse it
| Panel | ||||||
|---|---|---|---|---|---|---|
| ||||||
Please note that the Grouped type of a table view is available only for Excel XLSx and Web formats, it doesn't work with CSV and Excel XLS. |
You can send generated reports via email. Also, it is possible to specify several emails.
| Panel | ||||||
|---|---|---|---|---|---|---|
| ||||||
This feature is available only for CSV/Excel XLS/Excel XLSx formats of the report; it doesn't work with Web. |
Specify a currency of the report. All values will be automatically converted to the specified currency in the report.
Select a code deck from a drop-down list. All codes in the following report will be presented according to the specified code deck.
...
Screenshot: Summary Report section

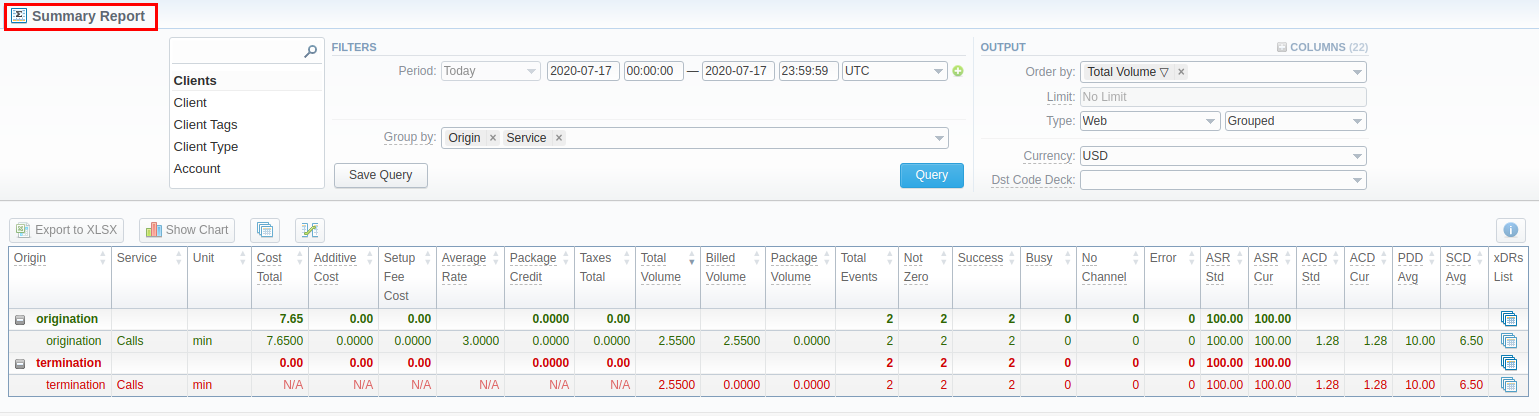
If the data is grouped in the report is grouped, it will be shown initially collapsed. To expand or collapse data in your report, click the ![]() plus or
plus or  minus icons. To expand all data in the report, please click Ctrl + the
 ![]() icon.
icon.
...
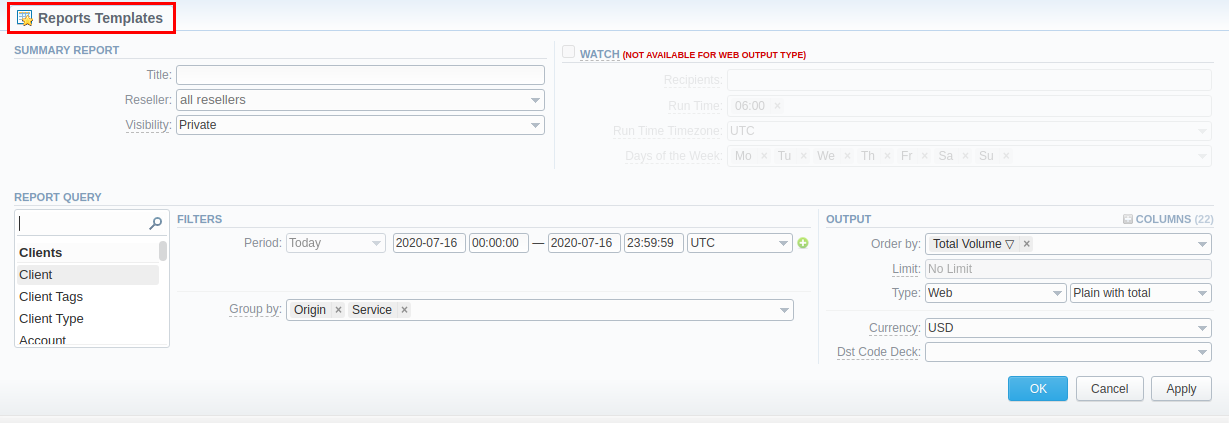
Also, you can create a template for reports and save specified parameters by clicking on the Save Query button. A pop-up window with settings will appear, and you will need to fill in the following form.
Screenshot: New Template form

To load already existed templates while generating statistic reports, click the Load Query button in the Summary Report section.
...
Screenshot: Summary Report section

Side-by-side report
This tool allows building a report with side-by-side sub-reports. Use it to run a comparative analysis on the same page. It's helpful for reviewing multiple parameters, totals, and compare results at different time intervals. The Compare Period option is designed to create a report that shows two sub-reports side-by-side. You can view more info about it in the article How to compare report parameters over the periods?.
To enable this option, click on the plus  icon next to the Period field and specify both intervals (Period 1/Period 2) for the report.
Screenshot: Summary Report section

Then , choose columns for a main and comparative period in the report Output form. When all required parameters are specified, click the Query button.
...
You can modify a comparative mode by changing periods and columns. For example, to compare how different the cost total of the two periods is in percentage terms. To do this, choose the Cost Total (%) value from the Columns. Therefore, the final report splits Cost Total (%) into separate columns (see screenshot below).
Screenshot: Summary Report section

| Paneltip | ||||||
|---|---|---|---|---|---|---|
| ||||||
| ||||||
Example 1: If you select the Period to be Today 00:00:00 til 23:59:59, the Previous Period and Previous Day values would be the same and show yesterday. The Previous Week option would display the same day last week (i.e., Monday for Monday), the Previous Month option would show the same date last month, and the Previous Year will display the same date last year. Example 2: If you select the Period to be This Week, the system will take the period starting Monday 00:00:00 and up to 23:59:59 on the current day. That is if your current day is Thursday, This Week would be Monday to Thursday. The comparative periods will work accordingly, selecting the same periods from the past week, month, year. Only the Previous Day option will result in offsetting a period one day behind (if a period is Monday to Thursday, comparative would be Sunday to Wednesday). |
| Panel | ||||||
|---|---|---|---|---|---|---|
| ||||||
When you use the Compare Period option in the Summary Report and Orig-Term Report sections, default chart templates will not be accessible. |
Sharing a Report
Each time you get a report output, the system generates a unique link in the format of "/view?id=<uniq-string>". It allows sharing data between the users, even if they belong to different resellers (the feature works similarly to Share by Link in Google Drive).
The link refers to the report data valid for a specific moment.
Example: When you send a link to a report, you ensure the recipient would see the same data as you do. If you change data in the system (for example, perform rerating), the previously copied link to the report will display data valid for the moment of generation (even though the actual data is now different).
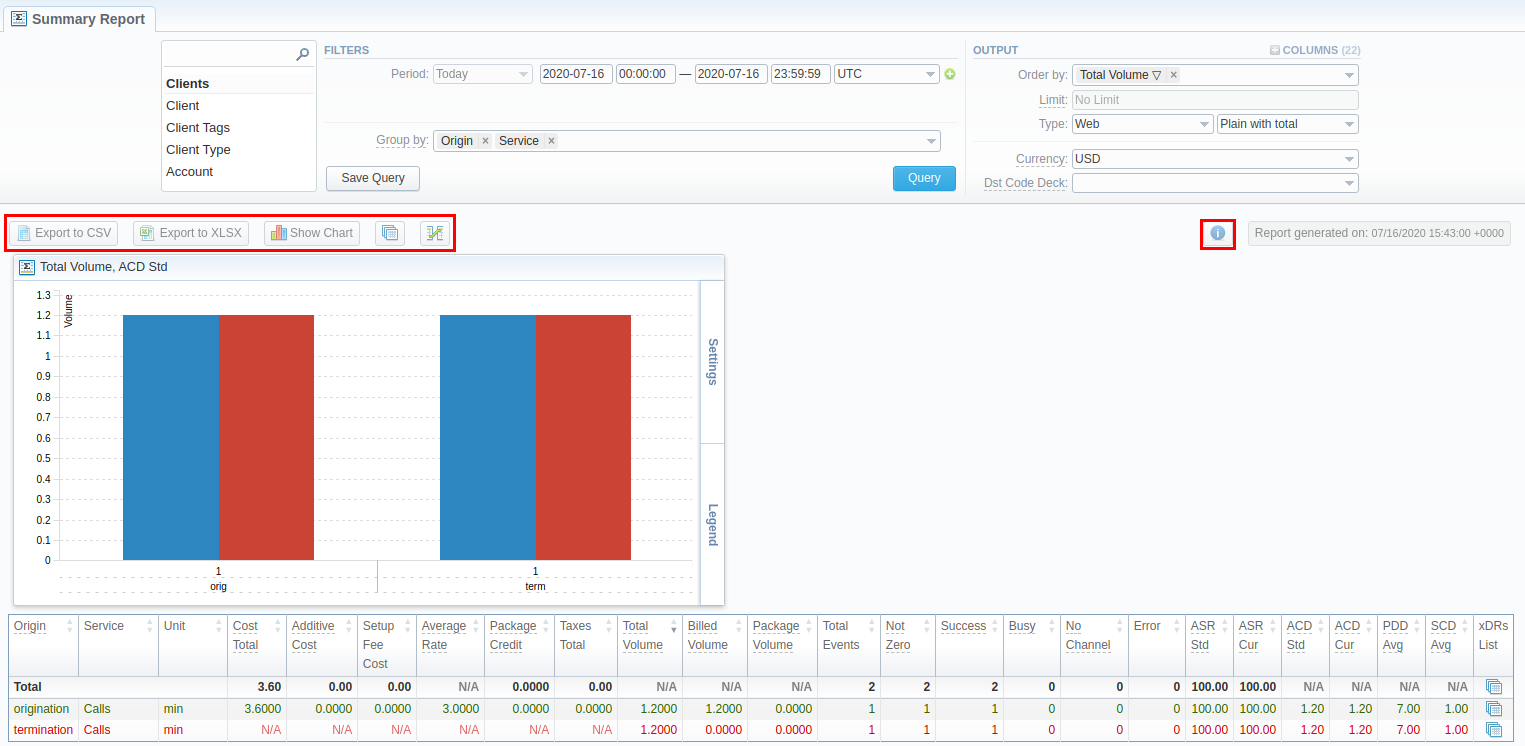
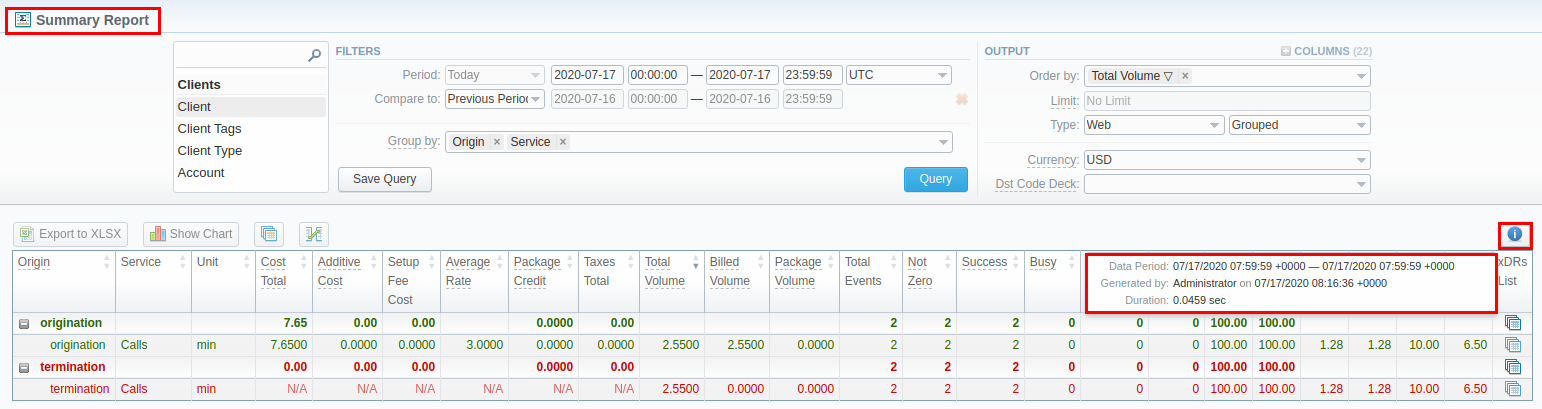
You can also view the additional information about the generated report by hovering over the Info ![]() icon, which is located under the Output section:
icon, which is located under the Output section:
Title | Description |
|---|---|
| Data Period | States the period set for a report |
| Data Period 2 | States the period set for a Compare Mode |
| Generated by | Indicates the Role of the user who generated a report and specifies a generation time |
| Duration | Time spent to generate a report |
Screenshot: Summary report Info icon
Knowledge Base Articles
Content by Label showLabels false spaces +KB showSpace false sort modified reverse true cql label = "stats_summary" and space = "KB" labels +stats_summary
Overview
Content Tools