Docs for all releases
Page History
| Panel | ||
|---|---|---|
| ||
|
Rates Analysis Form
Rates Analysis is an advanced feature of the JeraSoft Billing Rates Management Module. It allows you to analyze and compare rates within the JeraSoft Billing web interface without the usage of any third-party software.
Screenshot: Rates Analysis section
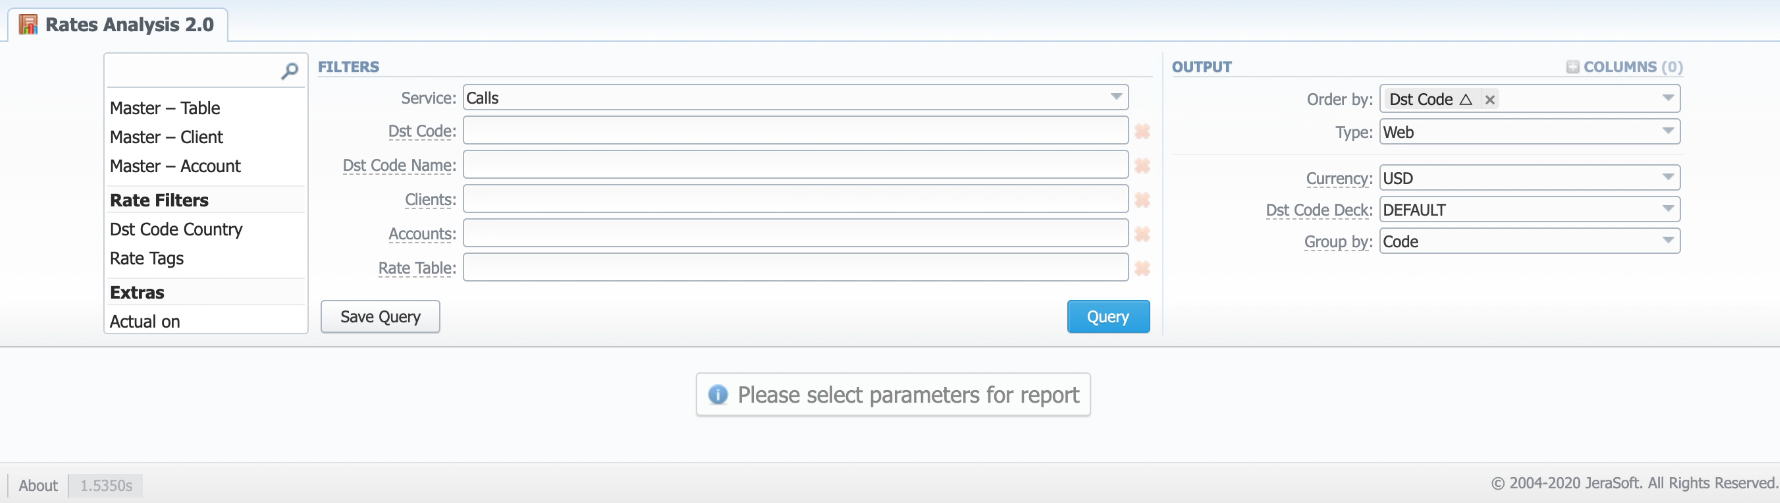
Creating a New Analysis Report
To analyze and compare different rates, you need to fill in the form with the next parameters:
| Information Block | Field Description | ||||||||||
|---|---|---|---|---|---|---|---|---|---|---|---|
| Filters | On the Filters menu, select the required parameters for the report. To cancel any filter, click on the delete | ||||||||||
| Service | Select a service for rates analysis. Default is calls | ||||||||||
| Dst Code | Specify a code of the needed destination
| ||||||||||
| Dst Code Name | Define a code name of the desired destination | ||||||||||
| Clients | Indicate termination clients for analysis | ||||||||||
| Accounts | Indicate termination accounts for analysis | ||||||||||
| Rate Table | Define rate tables for analysis | ||||||||||
Additional Filters | |||||||||||
Master Source | |||||||||||
| Master - Table | Specify a rate table that all other rates will be compared to | ||||||||||
| Master - Client | Specify an origination client that all other rates will be compared to | ||||||||||
| Master - Account | Specify an origination account that all other rates will be compared to | ||||||||||
| Rate Filters | |||||||||||
| Dst Code Country | Enter the name of the respective country | ||||||||||
| Rate Tags | Indicate a tag, which relates to specific rates | ||||||||||
| Extras | |||||||||||
| Actual on | Define the date, when the rates should be effective on
| ||||||||||
| Volume Interval | Specify the number of days of statistics that would be taken for analysis | ||||||||||
| Output | This information block contains settings of the report output data. Click the plus | ||||||||||
| Accessible columns in the report | |||||||||||
The list of additional columns include:
| |||||||||||
| Order by | Select parameters to sort already grouped data in columns. Here you can sort data from highest to lowest values (or vice versa) and select different values | ||||||||||
| Type | Choose a format of the report from a drop-down list:
If CSV or Excel XLSx type has been selected, an additional Send to field will be displayed. In this field, you can specify emails of the clients, to which the current report in the selected format will be sent. | ||||||||||
| Currency | Specify the currency of the report. All values will be automatically converted to the specified currency in the report | ||||||||||
| Dst Code Deck | Select a code deck from a drop-down list. All codes in the following report will be presented according to the specified code deck
| ||||||||||
Group by | Select a grouping option from the following list:
This option is intended to simplify grouping, the system will automatically group data in specified columns. If certain termination entities will have different prices within the same Code Name, the rows will be displayed separately. | ||||||||||

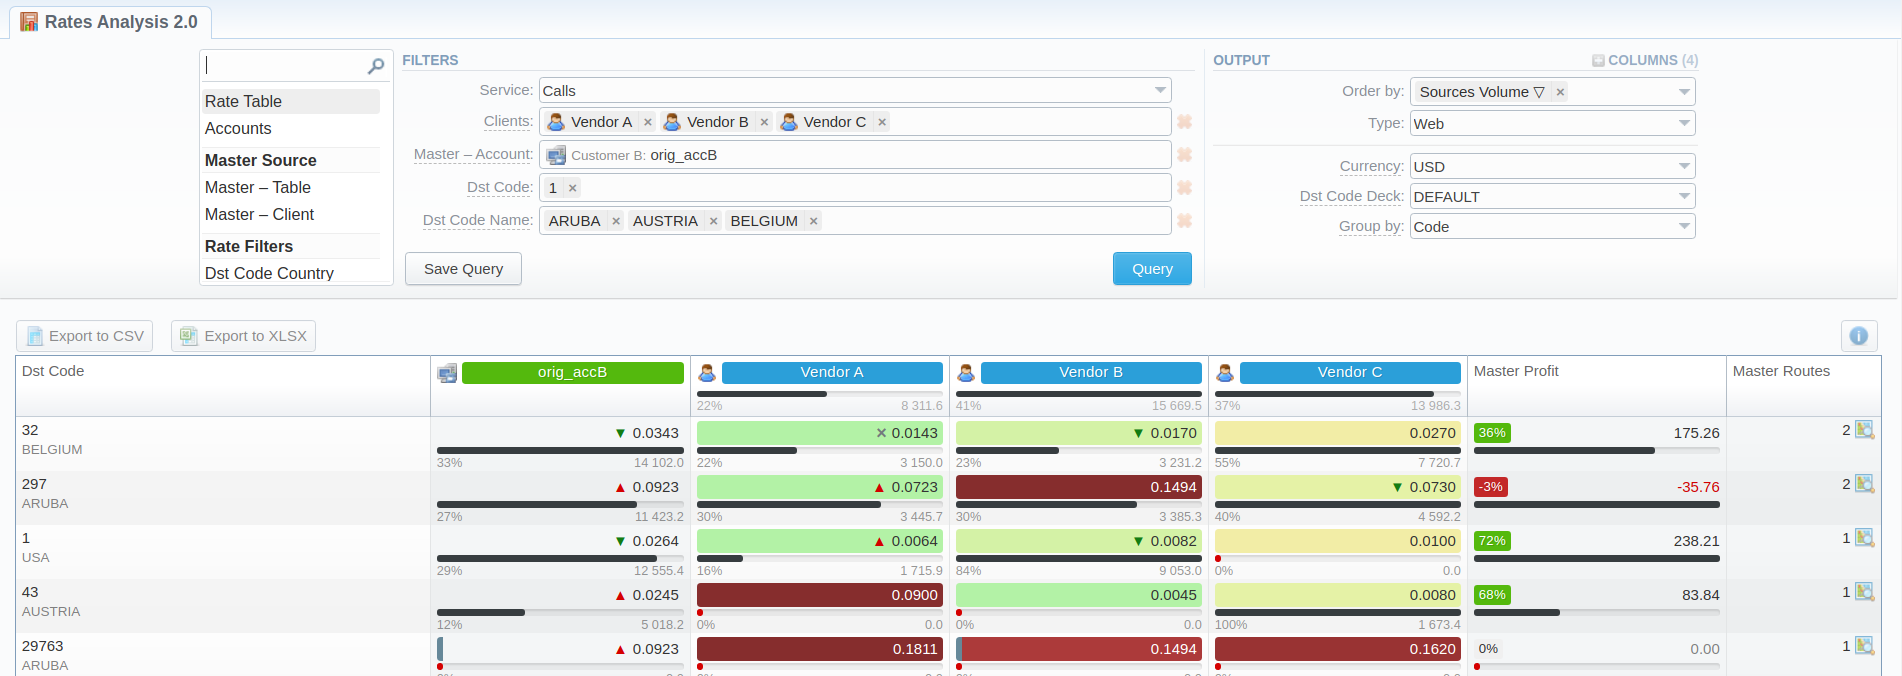
After clicking the Query button, the system will form a list of rates with prices for each destination. The appeal of rates is visualized as a heat map for convenience. The darker the red - the least profitable, the brighter the green - the more, respectively.
Screenshot: Rates Analysis section output
By hovering over the Info  icon above the report on the right, the user's name, time/date, when a report was generated, and Durationwill be displayed in a window.
Screenshot: Info icon

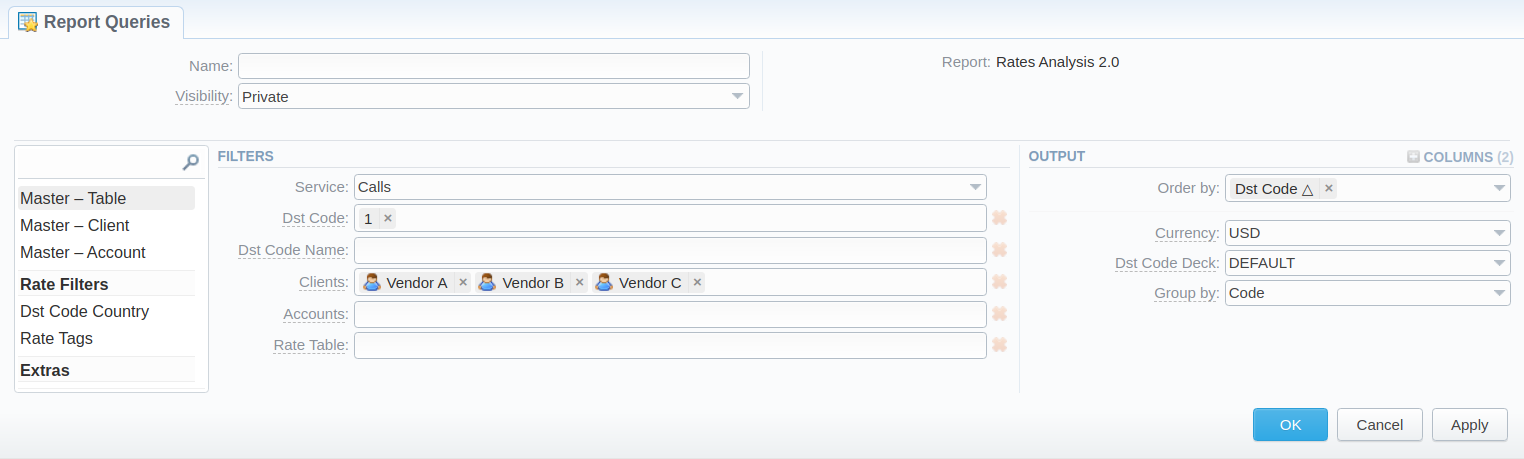
Creating a New Report Query
Also, you can create a template and save specified parameters by clicking the Save Query button. A pop-up window with settings will appear, where you need to fill out the following form:
Screenshot: New Report Query form
After a template has been created, a new Load Query button will be added to the section. By clicking it, you can select report settings to be filled in from a list of templates for rates analysis.
Export generated report
You can export report data either in .xlsx file or .csv that would contain currently presented data. Click the Export to XLSx or Export to CSV button above the report output to download a file of the respective format.
Sharing a Report
Each time you get a report output, the system generates a unique link in the format of "/view?id=<uniq-string>". It allows sharing data between the users, even if they belong to different resellers (the feature works similarly to Share by Link in Google Drive).
The link refers to the report data valid for a specific moment.
Example: When you send a link to a report, you ensure the recipient would see the same data as you do. If you change data in the system (for example, perform rerating), the previously copied link to the report will display data valid for the moment of generation (even though the actual data is now different).
You can also view the additional information about the generated report by hovering over the Info ![]() icon, which is located under the Output section:
icon, which is located under the Output section:
Title | Description |
|---|---|
| Generated by | Indicates the Role of the user who generated a report and specifies a generation time |
| Duration | Time spent to generate a report |
Overview
Content Tools