Docs for all releases
Page History
...
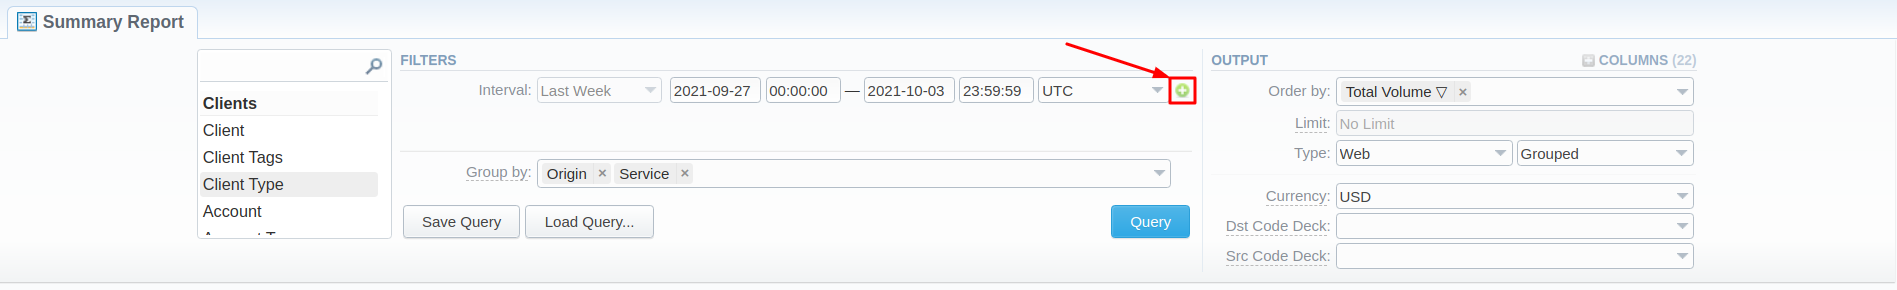
Screenshot: Summary Report query form

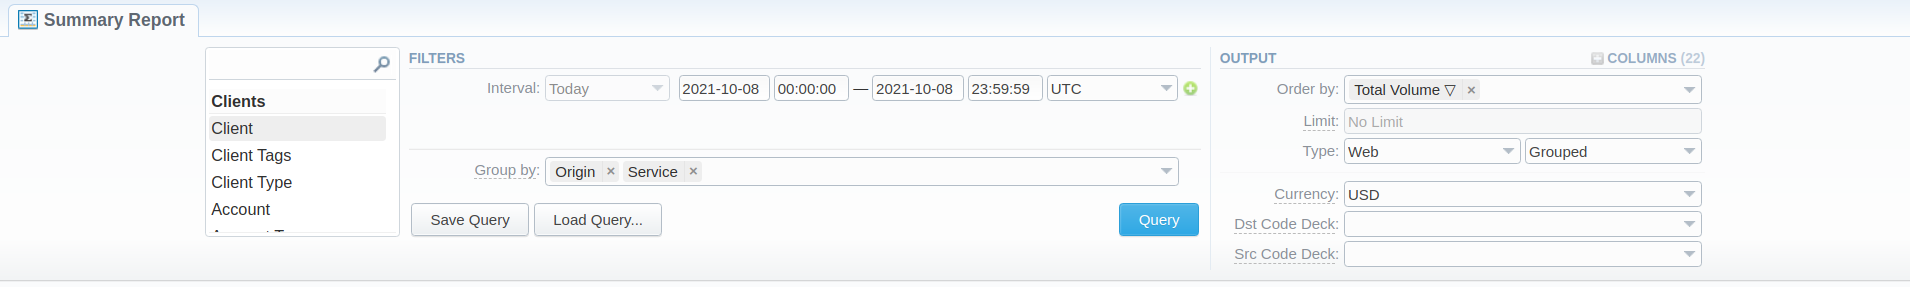
Creating a New Summary Report
...
| Information block | Field Description | |||||||||
|---|---|---|---|---|---|---|---|---|---|---|
| Filters | On the Filters menu, select the required parameters for the report. To cancel any filter, click on the delete You can start a quick search by typing filters' names in the field at the top of a drop-down menu with filters. | |||||||||
| Period (1)Interval | Specify the time interval for the report and a timezone. Please note that the PeriodInterval field is mandatory. Period 2 | |||||||||
| Compare to | Accessible when you enable the Compare Period option by clicking click on the plus
| |||||||||
| Group by | Select from the list of the following accessible options to group the data in reports:
| |||||||||
Additional Filters | ||||||||||
The accessible additional filters are:
| ||||||||||
| Output | This form contains settings of the report output data. Click the plus | |||||||||
| Accessible columns in the report | ||||||||||
The list of additional columns include: Columns for the main periodinterval: Cost Total, Setup Fee Cost, Average Rate, Package Credit, Total Volume, Billed Volume, Package Volume, Total Events, Not Zero, Success, Busy, No Channel, Error, ASR Std, ASR Cur, ACD Srd, ACD Cur, PDD Avg, SCD Avg, xDRs List, Taxes Total, Additive Cost. Columns for the comparative periodinterval are the same as for the main period. Moreover, all parameters could be selectedexpressed in percentage. | ||||||||||
Rate | Avg. Rate - an average cost calculated | |||||||||
| Totals |
| |||||||||
| Statistics | ASR - average success rate (successful records percentage)
ACD - average call duration in minutes
PDD Avg - average post-dial delay in seconds SCD Avg - average session connect delay in seconds | |||||||||
xDRs List - list of detailed records statistics | ||||||||||
| Other output settings | ||||||||||
| Order by | Select parameters to sort already grouped data in columns. Here you can sort data from highest to lowest values (or vice versa) and select different values. | |||||||||
| Type | Choose a format of the report from a drop-down list: Web/CSV/Excel XLS/Excel XLSx Also, select a look of a table view next to the Type field:
| |||||||||
| Limit | Determine the number of rows that will be visible in the report. It is useful for displaying some top positions by the chosen parameter. It is available only for the Plain report type. | |||||||||
| Send to | You can send generated reports via email. Also, it is possible to specify several emails.
| |||||||||
| Currency | Specify a currency of the report. All values will be automatically converted to the specified currency in the report. | |||||||||
| Code Deck | Select a code deck from a drop-down list. All codes in the following report will be presented according to the specified code deck. | |||||||||

...
Screenshot: Summary Report section

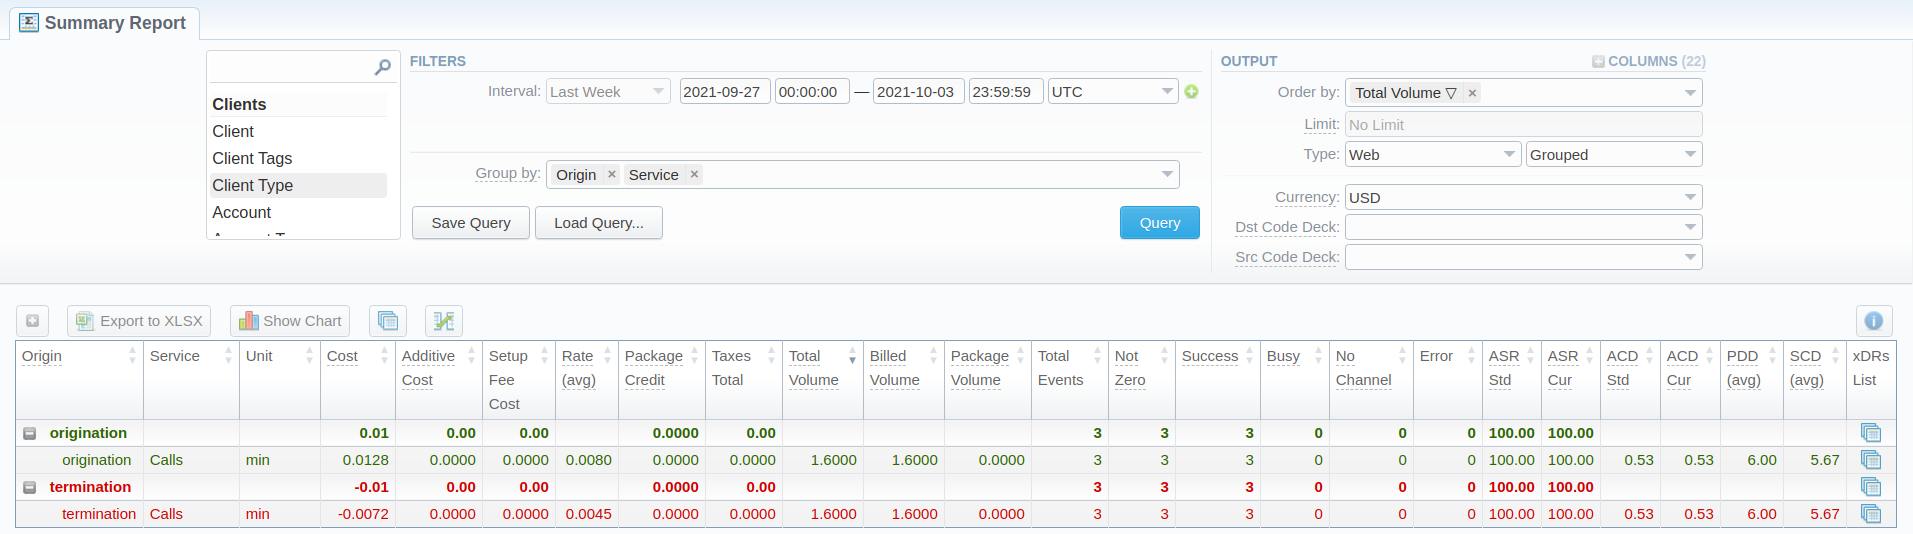
If the data in the report is grouped, it will be shown initially collapsed. To expand or collapse data in your report, click the ![]() plus or
plus or  minus icons. To expand all data in the report, please click Ctrl + the
 ![]() icon.
icon.
...
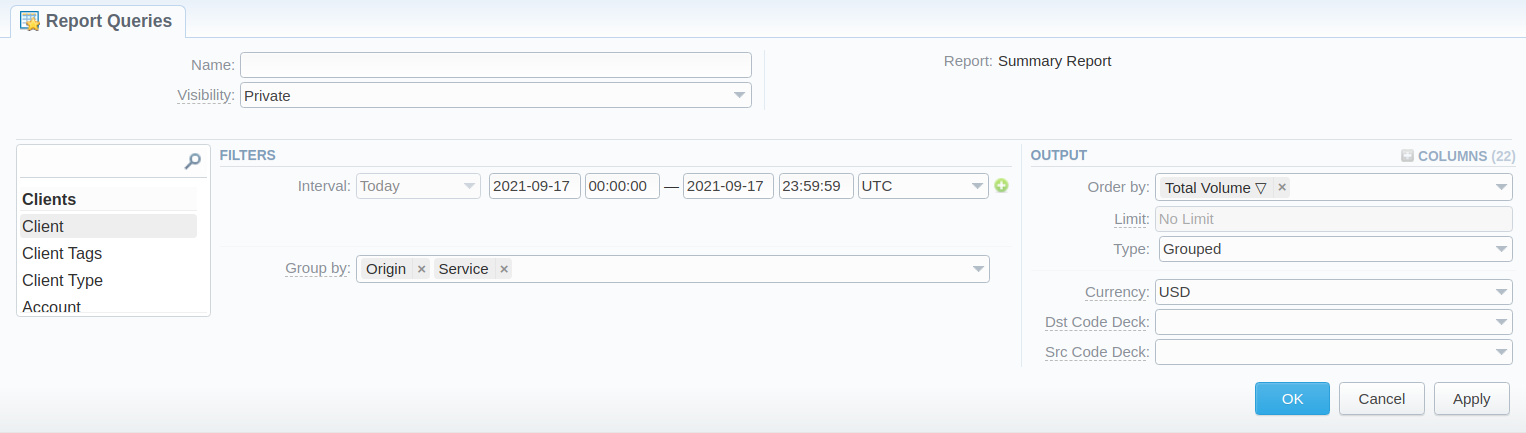
Also, you can create a template for reports and save specified parameters by clicking on the Save Query button button. A pop-up window with settings will appear, and you will need to fill in the following form.
Screenshot: New Template form

To load already existed templates while generating statistic reports, click the Load Query button in the Summary Report section.
| Panel | ||||||||
|---|---|---|---|---|---|---|---|---|
| ||||||||
To find more details about templates, please refer to the Report TemplatesQueries article in our User Guide. |
...
| Panel | ||||||||
|---|---|---|---|---|---|---|---|---|
| ||||||||
When you make a report based on two periodsintervals, two xDRs list
When you make a report and filter data by Client/Client Tags/Account/Code/Code Name/Owner parameters, two Orig-Term icons
|


...
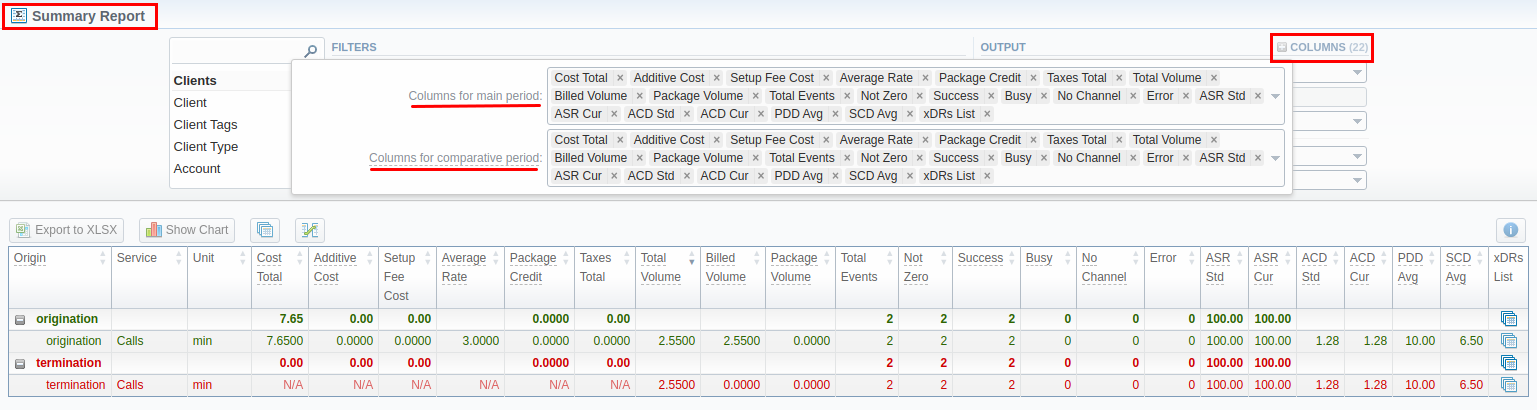
Screenshot: Summary Report section

Side-by-side report
This tool allows building a report with side-by-side sub-reports. Use it to run a comparative analysis on the same page. It's helpful for reviewing multiple parameters, totals, and compare results at different time intervals. The Compare Periodto option is designed to create a report that shows two sub-reports side-by-side. You can view more info about it in the article How to compare report parameters over the periods?.
To enable this option, click on the plus  icon next to the Period Interval field and specify both intervals (Period 1/Period 2) for and specify both intervals for the report.
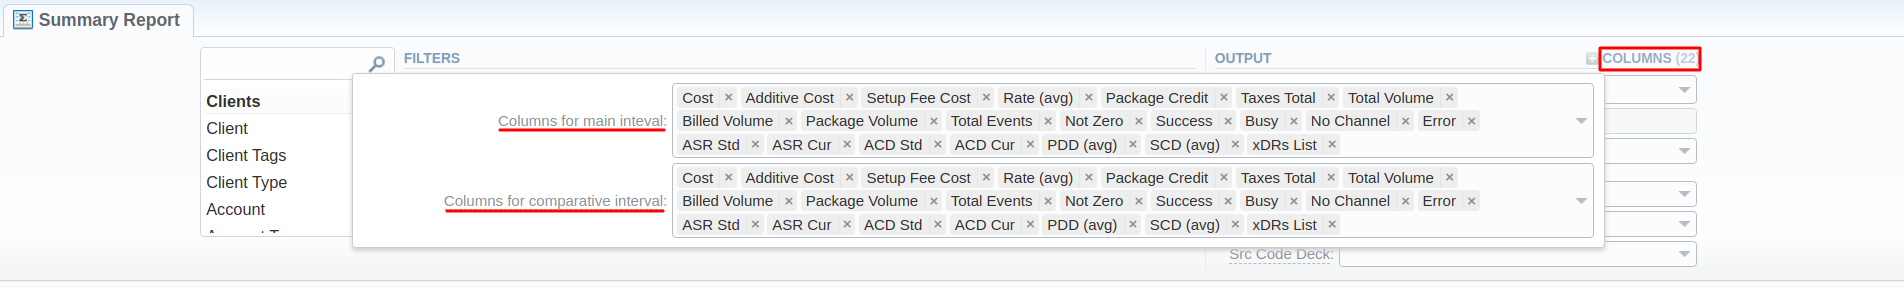
Screenshot: Summary Report section

Then choose columns for a main and comparative period in the report Output form. When all required parameters are specified, click the Query button.
...
Screenshot: Summary Report section
| Tip | ||
|---|---|---|
| ||
Example 1: If you select the Period Interval to be Today 00:00:00 til 23:59:59, the Previous PeriodInterval and Previous Day values would be the same and show yesterday. The Previous Week option would display the same day last week (i.e., Monday for Monday), the Previous Month option would show the same date last month, and the Previous Year will display the same date last year. Example 2: If you select the Period Interval to be This Week, the system will take the period starting Monday 00:00:00 and up to 23:59:59 on the current day. That is if your current day is Thursday, This Week would be Monday to Thursday. The comparative periods will work accordingly, selecting the same periods from the past week, month, year. Only the Previous Day option will result in offsetting a period one day behind (if a period is Monday to Thursday, comparative would be Sunday to Wednesday). |
...
| Panel | ||||||
|---|---|---|---|---|---|---|
| ||||||
When you use the Compare Periodto option in the Summary Report and Orig-Term Report sections, default chart templates will not be accessible. |
...
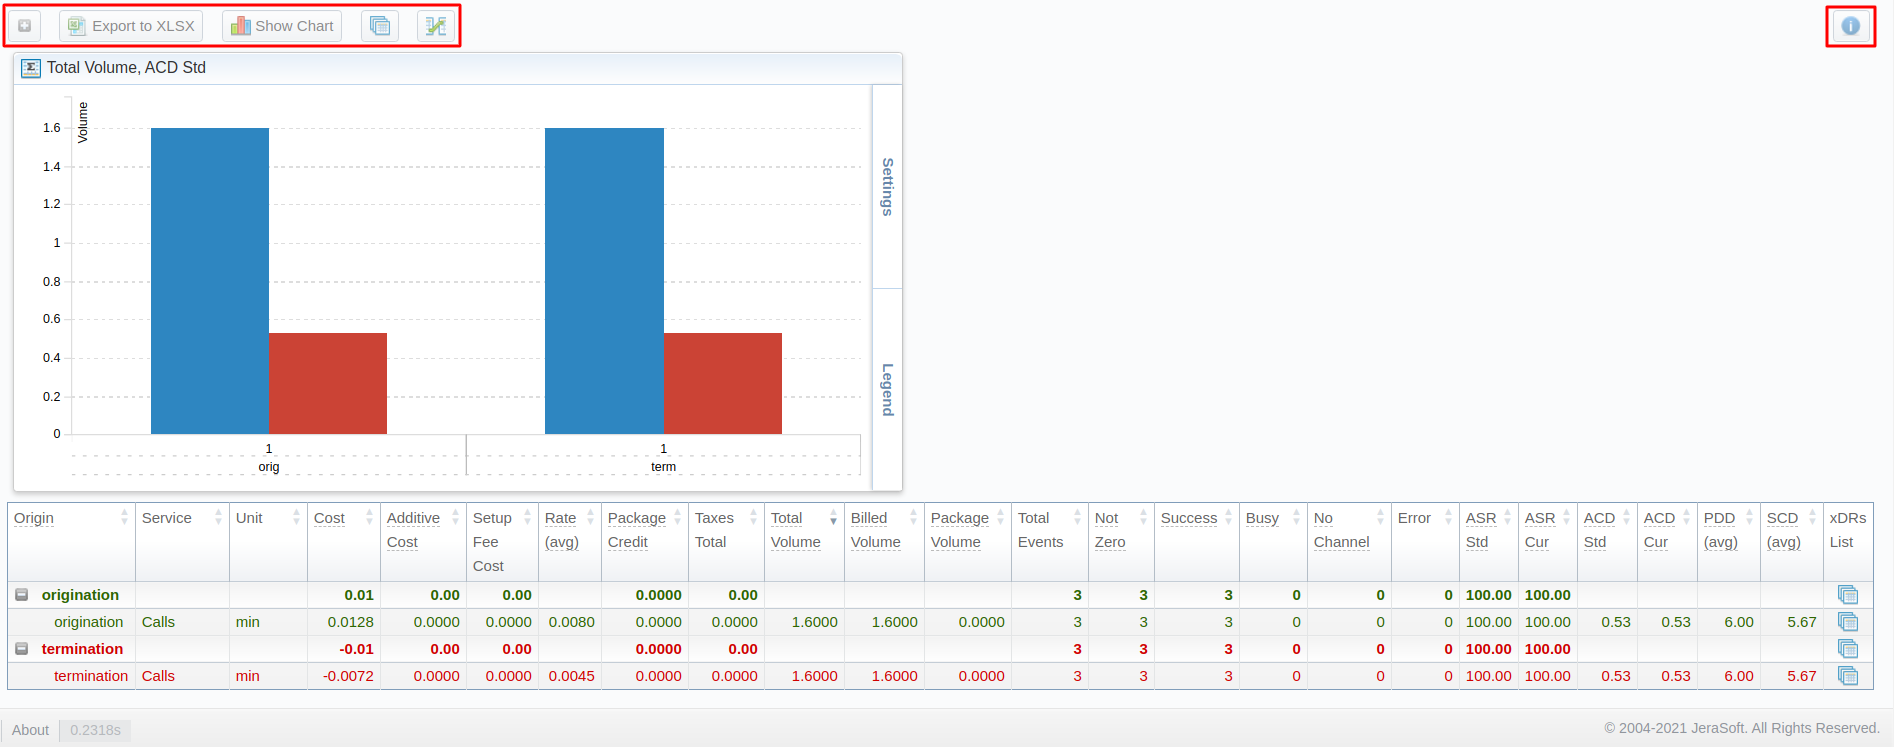
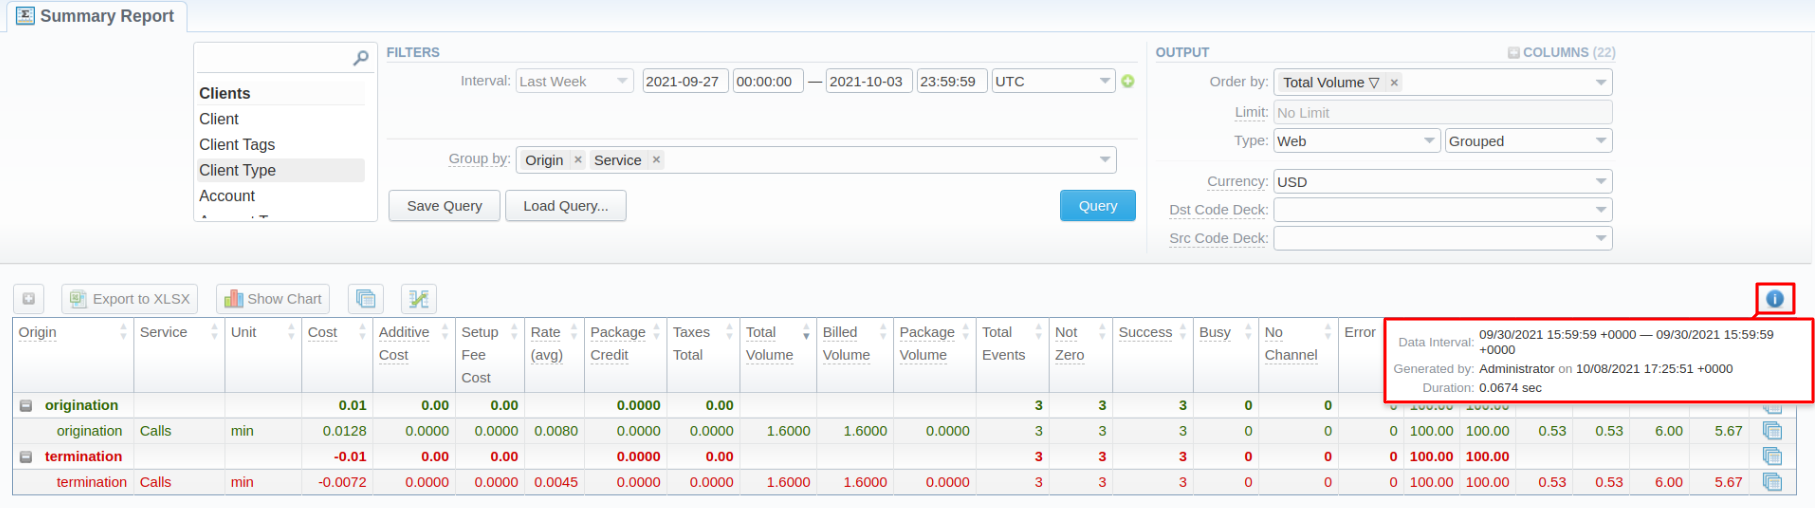
You can also view the additional information about the generated report by hovering over the Info ![]() icon, which is located under the Output section:
icon, which is located under the Output section:
Title | Description |
|---|---|
| Data PeriodInterval | States the period set for a report |
| Data Period Interval 2 | States the period set for a Compare Mode |
| Generated by | Indicates the Role of the user who generated a report and specifies a generation time |
| Duration | Time spent to generate a report |
Screenshot: Summary report Info icon

Knowledge Base Articles
...
Overview
Content Tools