Docs for all releases
Page History
...
| Information block | Field Description | |||||||||||
|---|---|---|---|---|---|---|---|---|---|---|---|---|
| Filters | On the Filters menu, select the required parameters for the report. To cancel any filter, click the delete | |||||||||||
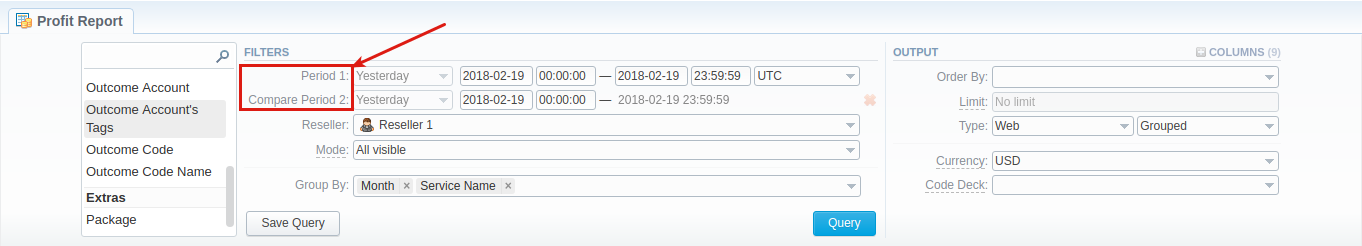
| Period (1) | Specify the time interval for the report and a timezone. Please note that the Period field is mandatory. | |||||||||||
| Period 2 | Accessible when you enable the Compare Period option by clicking on the plus
| |||||||||||
| Reseller | Specify the name of a target Reseller. | |||||||||||
| Mode | Choose the mode of the report:
By default, the field value is set to All visible | |||||||||||
| Group by | Select a grouping option. Here you can choose and swap columns, as well as change their order. There are the following accessible options to group data in reports:
| |||||||||||
| Additional Filters | ||||||||||||
There are the following accessible filters:
| ||||||||||||
| Income Client | Specify an origination client(s) for the report | |||||||||||
| Income Client's Tag | Specify a tag(s) assigned to origination clients | |||||||||||
| Income Account | Determine an origination client's account(s) | |||||||||||
| Income Account's Tag | Indicate origination account's tags | |||||||||||
| Income Code | Define an incoming code | |||||||||||
| Income Code Name | Specify an incoming code name | |||||||||||
| Income Serial | Indicate a serial number of the originator's calling card | |||||||||||
| Income Reseller | Specify a target reseller(s) for the report | |||||||||||
| Outcome Client | Define a termination client(s) | |||||||||||
| Outcome Client's Tag | Define a termination client's tag(s) | |||||||||||
| Outcome Account | Indicate an account(s) of the termination client(s) for the report | |||||||||||
| Outcome Account's Tag | Specify termination account's tags if any | |||||||||||
| Outcome Code | Specify a termination code of the client | |||||||||||
| Outcome Code Name | Indicate a termination code name | |||||||||||
| Package | Determine the name of the used package | |||||||||||
| Service | Specify the service | |||||||||||
| Output | This form contains settings of the report output data. Click a plus | |||||||||||
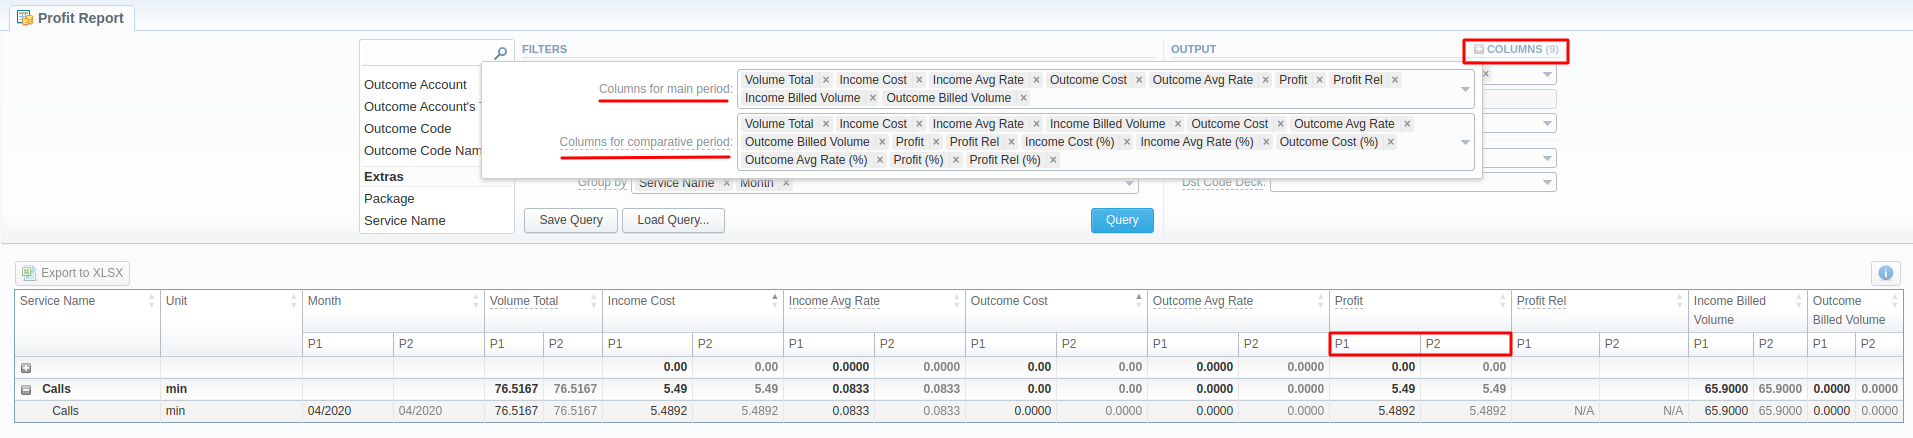
| Accessible columns in the report | ||||||||||||
Additional columns of the report are: Columns for the main period: Volume Total, Income Cost, Income Avg Rate, Income Billed TimeVolume, Outcome Cost, Outcome Avg Rate, Outcome Billed TimeVolume, Profit, Profit (%)rel. Columns for the comparative period: Volume Total time, min; Income Rate, Outcome Rate, Income Cost, Income Avg Rate, Income Billed TimeVolume, Outcome Cost, Outcome Avg Rate, Outcome Billed TimeVolume, Profit, Profit rel, Profit (%), Profit Differencerel (%), Income Cost (%), Outcome Cost (%), Income Avg Rate (%), Outcome Avg Rate (%), Income Billed Volume (%), Outcome Billed Volume (%), Volume Total (%). And it's possible to choose each parameter expressed in percentage. | ||||||||||||
Volume Total | Total time of calls in minutes | |||||||||||
| Rate | The call rate
| |||||||||||
| Profit | The revenue
| |||||||||||
| Time | The billed time
| |||||||||||
| Cost | The call cost
| |||||||||||
Other output settings | ||||||||||||
| Order by | Select parameters to sort already grouped data in columns. There are the following accessible options to order the data: by Time, Clients, Extras. Here you can sort data from highest to lowest values (or vice versa) and select different values. | |||||||||||
| Type | Choose a report format from a drop-down list: Web/CSV/Excel XLS/Excel XLSx Also, select a table view next to the Type field:
| |||||||||||
| Limit | Determine the number of rows that will be visible in the report. It is useful for displaying some top positions by a chosen parameter. It is available only for the plain type of report. | |||||||||||
| Send to | You can send generated reports via email. Also, it is possible to specify several emails.
| |||||||||||
| Currency | Specify a currency for the report. All values will be automatically converted to the specified currency in the report. | |||||||||||
| Code Deck | Using a drop-down list, select a respective code deck. All code names will be rewritten and presented according to the specified code deck. If there is no value specified, the code deck assigned to the Client or Rate Table will be in usage. | |||||||||||


...
Screenshot: Profit report section
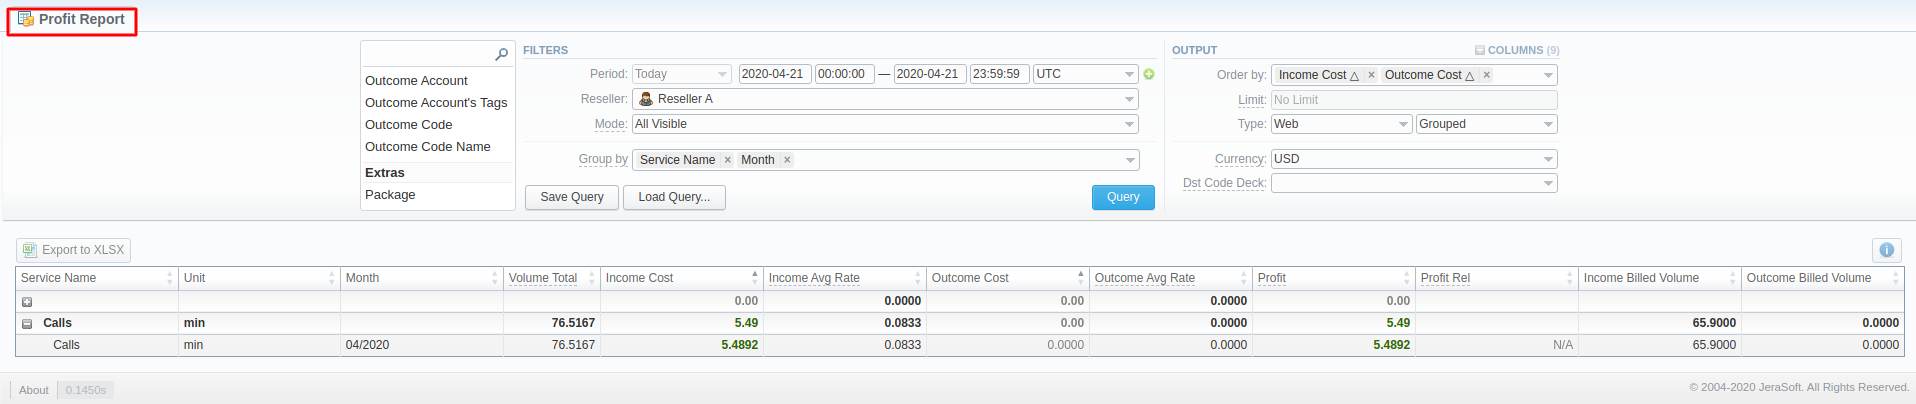

If the data is grouped in the report, it will be shown initially collapsed. To expand or collapse data in your report, click the ![]() plus or
plus or  minus icons.
| Panel | ||||||||
|---|---|---|---|---|---|---|---|---|
| ||||||||
Please note , that the system shows rounded values in the reports. However, while calculating the system takes an exact value. Hence, the procedure of the rounding is as follows:
|
...
| Section | Description | ||||||||||
|---|---|---|---|---|---|---|---|---|---|---|---|
| Profit Report | Here you can specify parameters for the template that will be used while running reports | ||||||||||
| Title | Specify a name of the template | ||||||||||
| Reseller | Indicate a Reseller of the report template | ||||||||||
| Visibility | It allows controlling the visibility of respective reports templates. Whether you want to keep templates private or leave them visible for users under a specified Reseller. To enable this option, select one parameter from the drop-down list:
| ||||||||||
| Watch | This tool allows to generate reports automatically at the appropriate time and send the results to the list of e-mails
| ||||||||||
| Recipients | Specify recipients: it can be your own email, other users of the system or even 3rd parties | ||||||||||
| Run Time | Define an appropriate time to generate a report automatically. It could be several times, for example, 10:00, 12:00, 18:00 | ||||||||||
| Days of Week | Indicate days of the week to generate a report automatically. For example, you can run a report only on Monday or each day of week | ||||||||||
| Report Query | Here you need to specify filters that will be used for generating a correct report and choose the output type to view the report. | ||||||||||
...
| Panel | ||||||
|---|---|---|---|---|---|---|
| ||||||
You can check an actual date interval of the report by clicking the Info |

...
Screenshot: Profit Report query form
Then , choose columns for the main and comparative period in the report Output form. When all required parameters are specified, click the Query button.
...
Screenshot: Profit Report query form
Sharing a Report
Each time you get a report output, the system generates a unique link in the format of "/view?id=<uniq-string>". It allows sharing data between the users, even if they belong to different resellers (the feature works similarly to Share by Link in Google Drive).
The link refers to the report data valid for a specific moment.
Example: When you send a link to a report, you ensure the recipient would see the same data as you do. If you change data in the system (for example, perform rerating), the previously copied link to the report will display data valid for the moment of generation (even though the actual data is now different).
You can also view the additional information about the generated report by hovering over the Info ![]() icon, which is located under the Output section:
icon, which is located under the Output section:
Title | Description |
|---|---|
| Data Period | States the period set for a report |
| Generated by | Indicates the Role of the user who generated a report and specifies a generation time |
| Duration | Time spent to generate a report |
Overview
Content Tools