Docs for all releases
Page History
...
This section is designed to help users create a report that would contain summary information regarding all exsiting services existing services from the perspective of both origination and termination sides. Not only can it provide a general overview of total services cost and billed volumes of service units, but it can be customized to outline even more detailed information regarding different client types, ASR / ACD Current, etc.
Screenshot: Summary Report query form
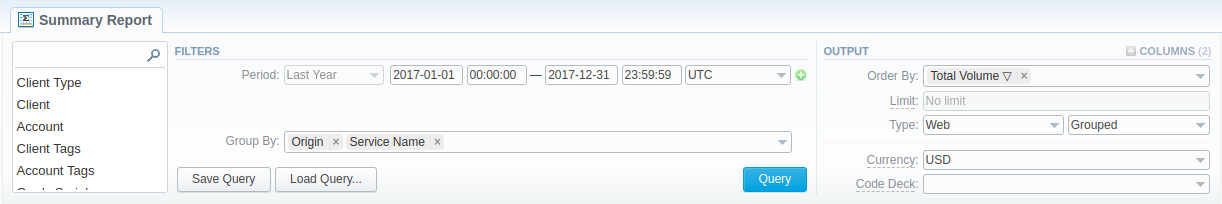
Creating a New Summary Report
To create a new summary report, you need to fill in the following parameters in the form and press click the Query button:
| Information block | Field Description | |||||||||
|---|---|---|---|---|---|---|---|---|---|---|
| Filters | On the Filters menu, select select the required parameters for the report. To cancel any filter, click on the delete You can start a quick search by typing filters' names in the field at the top of a drop-down menu with filters. | |||||||||
| Period (1) | Specify the time interval for the report and a timezone. Please note that the Period field is mandatory. | |||||||||
| Period 2 | Accessible when you enable the Compare Period option by clicking on the plus | |||||||||
| Group Byby | Select from the list of the following accessible options to group the data in reports:
| |||||||||
Additional Filters | ||||||||||
The accessible additional filters are:
| ||||||||||
| Client Type | Select a client's type for the report: Client, Reseller, Calling card Card or Call shop | |||||||||
| Client | Define a client for the report | |||||||||
| Account | Enter an account for the report | |||||||||
| Client/Account Tags | Define a client's or account's tag | |||||||||
| Cards Serial | Indicate cards serial for the report | |||||||||
| Package | Enter a package for the report | |||||||||
| Code | Specify a code of needed destination | |||||||||
| Code Name | Specify a code name of a desired destination | |||||||||
| Cost Total | Enter the range of total call cost | |||||||||
| Origin | Indicate an origin - origination or termination of the event | |||||||||
| Result Code | Define a result code as a filtering parameter | |||||||||
| Gateway | Specify a gateway | |||||||||
| Owner | Indicate the owner | |||||||||
| Total Volume | Enter the range of total duration | |||||||||
| Total Records | Enter the range of of total records | |||||||||
| Not Zero Records | Define the range of records that have duration equal to or more than 1 unit | |||||||||
| ASR Current | Specify the range of ASR Cur for records you would like to display | |||||||||
| ACD Current | Specify the range of ACD Cur for records you would like to display | |||||||||
| Service Name | Determine the name of service for the report | |||||||||
| Output | This form contains settings of the report output data. Click the plus | |||||||||
| Accessible columns in the report | ||||||||||
The list of additional columns include: Columns for the main period: Cost Total, Average Rate, Package Credit, Total Volume, Billed Volume, Package Volume, Total Records, Not Zero Records, Success Records, Busy Records, No Channel Records, Error Records, ASR Std, ASR Cur, ACD Srd, ACD Cur, PDD Avg, SCD Avg, xDRs List. Columns for the comparative period are the same as for the main period. Moreover, all parameters could be selectedexpressed in percentage. | ||||||||||
Rate | Avg. Rate - an average cost calculated | |||||||||
| Totals |
| |||||||||
| Statistics | ASR - Average success rate (successful records percentage)
ACD - Average call duration in minutes
PDD Avg - Average post-dial delay in seconds SCD Avg - Average session connect delay in seconds | |||||||||
| Extras | xDRs List - list of detailed records statistics | |||||||||
| Other output settings | ||||||||||
| Order Byby | Select parameters to sort already grouped data in columns. Here you can sort data from highest to lowest values (or vice versa) and select different values. | |||||||||
| Type | Choose a format of the report from a drop-down list: Web/CSV/Excel XLS/Excel XLSx Also, select next to the Type field select a look of a table view next to the Type field:
| |||||||||
| Limit | Determine the number of rows that will be visible in the report. It is useful for displaying some top positions by the chosen parameter. It is available only for the Plain report type of the report. | |||||||||
| Send to | You can send generated reports via email. Also, it is possible to specify several emails.
| |||||||||
| Currency | Specify a currency of the report. All values will be automatically converted in the report to the specified currencyin the report. | |||||||||
| Code Deck | Select a code deck from a drop-down list. All codes in the following report will be presented according to the specified code deck. | |||||||||

The example of the a generated summary report is presented on a screenshot down below:
Screenshot: Summary Report section
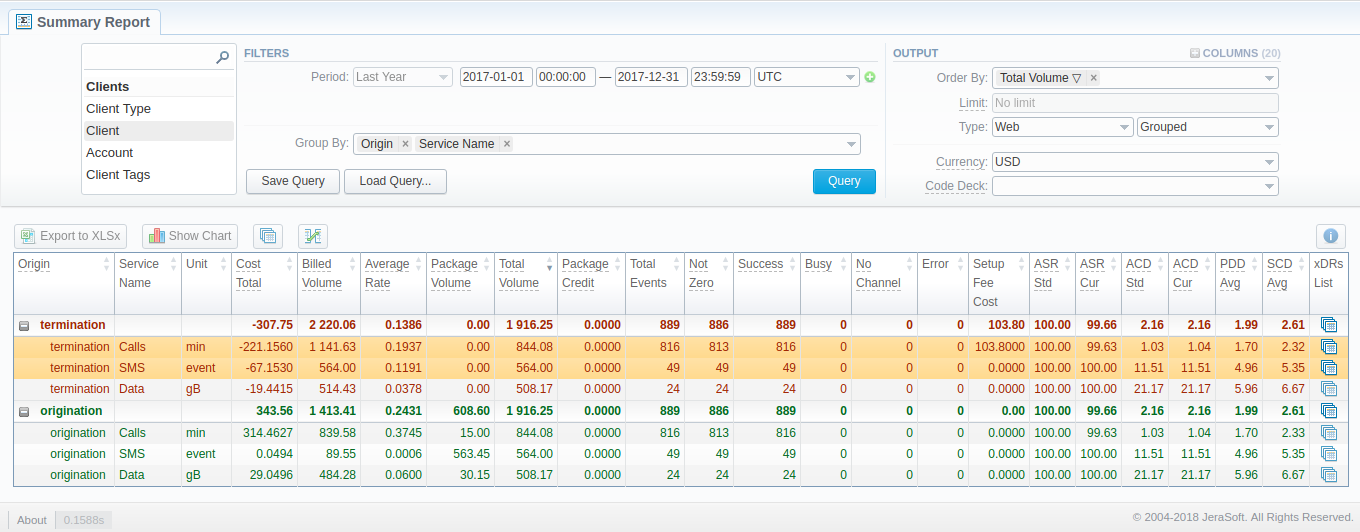
If the data is grouped in the report is grouped, it will be shown initially collapsed. To expand or collapse data in your report, click the the ![]() plus or or
plus or or  minus signs minus icons. To expand all data in the report, please press Ctrl click Ctrl + the
 ![]() icon.
icon.
| Panel | ||||||||
|---|---|---|---|---|---|---|---|---|
| ||||||||
Please note, the system shows rounded values in the reports. But while calculating, the system takes an exact value. Hence, the procedure of the rounding is following as follows:
|
Simple scheme: how to generate a summary report
In order to To create a simple summary report, you need to:
- On the Filters menu, select Select desired parameters for the report .on the Filters menu
- Enter the interval and specify a timezone
- Select parameters in the Group Byby field, for example, Currency, Origin, etc.
- Then choose Select Columns in the Output form, for example, Average Rate, ASR Std, ASR Cur, ACD Std, ACD Cur, Total Records, etc.
- Specify the Type field or leave its default settings (Web/Grouped)
- Specify the currency and choose the select a code deck (if applicable).
- Press Click the Query button.
| Panel | ||||||||
|---|---|---|---|---|---|---|---|---|
| ||||||||
|
Creating a Query Template
Also, you can create a template for reports and save specified parameters by clicking on on the Save Query button. A pop-up window with settings will appear, and you will need to fill in the following form.
Screenshot: New Template form
...
To load already existed templates while generating statistic reports click Load Query button reports, click the Load Query button in the Summary Report section.
...
You can export data to a CSV and or XLSx file, which contains only currently displayed data, with no automatic request to update data while exporting. Also, it is possible to create charts for easily for illustrating a crucial crucial information easily. And you You can generate a report using the same criteria in the Orig-Term report and the xDRs list sections.
...
2. To download an .xlsx report file, press click the Export to XLSx  button above the report.
...
| Panel | ||||||||
|---|---|---|---|---|---|---|---|---|
| ||||||||
When you make a report based on two periods, two xDRs list
When you make a report and filter data by Client/Client Tags/Account/Code/Code Name/Owner parameters, two Orig-Term icons
|


5. It is possible to generate a report using the same criteria in the Orig-Term section report by clicking the Orig-Term  icon on the toolbar.
6. You can check an actual date interval by clicking on on the Info  icon. The displayed data could be different from the Interval specified above if there is no date data for the period.
Screenshot: Summary Report section
...
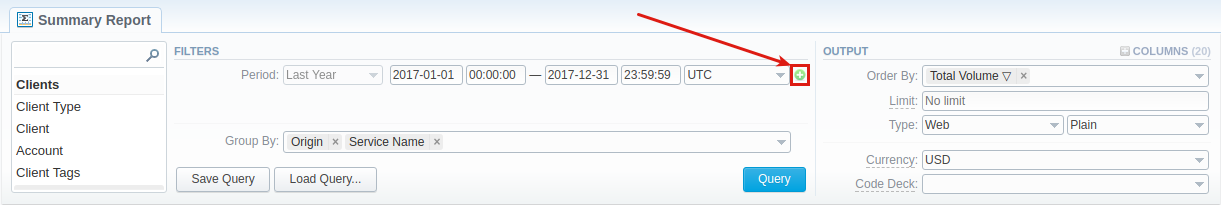
This tool allows building a report with side-by-side sub-reports. Use it to run a comparative analysis on the same page. It's helpful for reviewing multiple parameters, totals, and compare results at different time intervals. The Compare Period option is designed to create a report that shows two sub-reports side-by-side.
To enable this option, click on the plus  sign icon next to the Period field and specify both intervals (Period 1/Period 2) for the report.
Screenshot: Summary Report section
Then, choose columns for a main and comparative period in the report Output form. When all required parameters are specified, click the Query button.
...
| Panel | ||||||
|---|---|---|---|---|---|---|
| ||||||
|
Knowledge Base Articles
Content by Label showLabels false spaces +KB showSpace false sort modified reverse true cql label = "stats_summary" and space = "KB" labels +stats_summary
Overview
Content Tools