Docs for all releases
Page History
...
Screenshot: Summary Report section
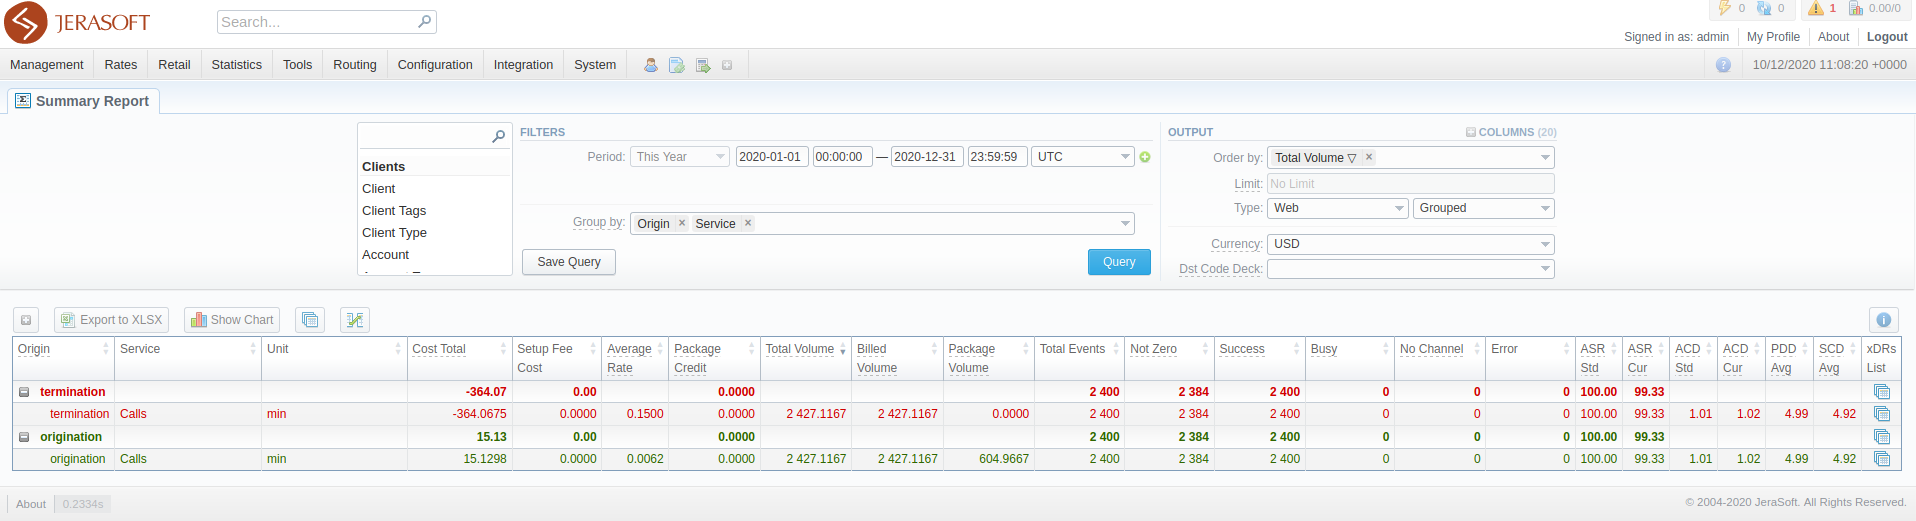
If the data in the report is grouped, it will be shown initially collapsed. To expand or collapse data in your report, click the ![]() plus or
plus or  minus icons. To expand all data in the report, please click Ctrl + the
 ![]() icon.
icon.
...
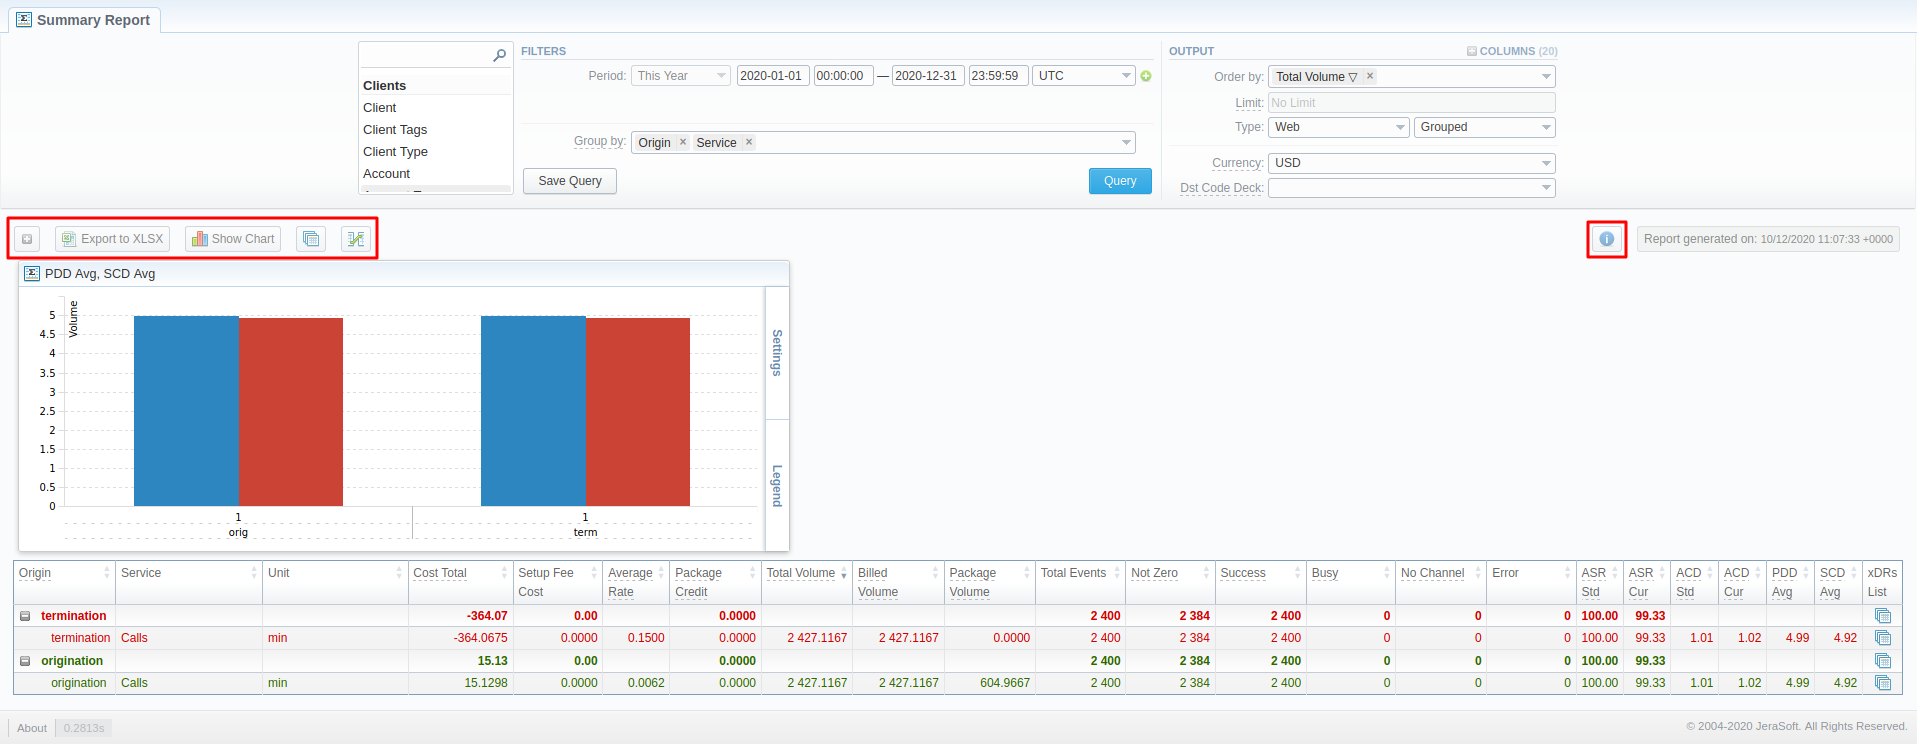
You can export data to a CSV or XLSx file, which contains only currently displayed data, with no automatic request to update data while exporting. Also, it is possible to create charts for illustrating crucial information easily. You can generate a report using the same criteria in the Orig-Term report and the xDRs list sections.
1. To expand/collapse all the data for the Grouped output, click on the ![]() icon above the report.
icon above the report.
2. To To download a report in .csv, click on the Export to CSV button above the report.
| Panel | ||||||
|---|---|---|---|---|---|---|
| ||||||
Please note, this button will be visible only when the Type of the output is Plain. For the Grouped output type it is not available. |
23. To download a .xlsx report file, click the Export to XLSx  button above the report.
34. To create a visual chart, click the Show Chart  button above the report. There is more information available on this topic in the article How to create a statistic chart? in our Knowledge Base.
45. You can generate a detailed report using the same criteria in the xDRs list section by clicking the xDRs list  icon above the report.
| Panel | ||||||||
|---|---|---|---|---|---|---|---|---|
| ||||||||
When you make a report based on two periods, two xDRs list
When you make a report and filter data by Client/Client Tags/Account/Code/Code Name/Owner parameters, two Orig-Term icons
|


56. It is possible to generate a report using the same criteria in the Orig-Term section by clicking the Orig-Term  icon on the toolbar.
67. You can check an actual date interval by clicking on the Info  icon. The displayed data could be different from the Interval specified above if there is no data for the period.
Screenshot: Summary Report section

Side-by-side report
...
Overview
Content Tools