Docs for all releases
Page History
| Panel | ||
|---|---|---|
| ||
|
Section overview
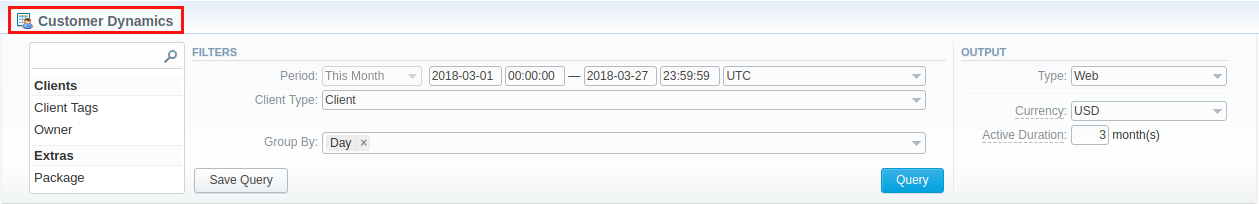
The Customer Dynamics section is designed to illustrate the data for analyzing and improving efficiency easily. Here, reports are presented in the form of a table. However, you can create a chart to interpret key information effectively and facilitate the decision-making process.
Screenshot: Customer Dynamics section/query form
Creating a New Report
To generate a report, you need to fill in the form and click the Query button. The query form consists of the following parameters:
| Information Block | Field Description | |||||||||
|---|---|---|---|---|---|---|---|---|---|---|
| Filters | On the Filters menu, select the required parameters for the report. To cancel any filter, click on the delete You can start a quick search by typing filters' names in the field at the top of a drop-down menu with filters. | |||||||||
| Period | Specify the time interval for the report and a timezone. Please note that the Period field is mandatory. | |||||||||
| Client Type | Select a client type from a drop-down list of the following options:
| |||||||||
| Additional Filters | ||||||||||
There are the following accessible additional filters:
| ||||||||||
| Client Tags | Specify certain tags to filter clients and show more detailed results in the report | |||||||||
| Owner | Define a reseller for the report | |||||||||
| Package | Enter a package for the report | |||||||||
| Group by | There are the following accessible options to group the data in reports:
| |||||||||
| Output | This form contains settings for the output data of the report. | |||||||||
| Type | Choose a format of the report from a drop-down list: Web/CSV/Excel XLS/Excel XLSx | |||||||||
| Send to | You can send generated reports via email. Also, it is possible to specify several emails.
| |||||||||
| Currency | Specify a currency for the report. All values will be automatically converted to the specified currency in the report. | |||||||||
| Active Duration | Determine the period (in months). If the customer has used any paid services within this period, (s)he will be considered an active client. | |||||||||

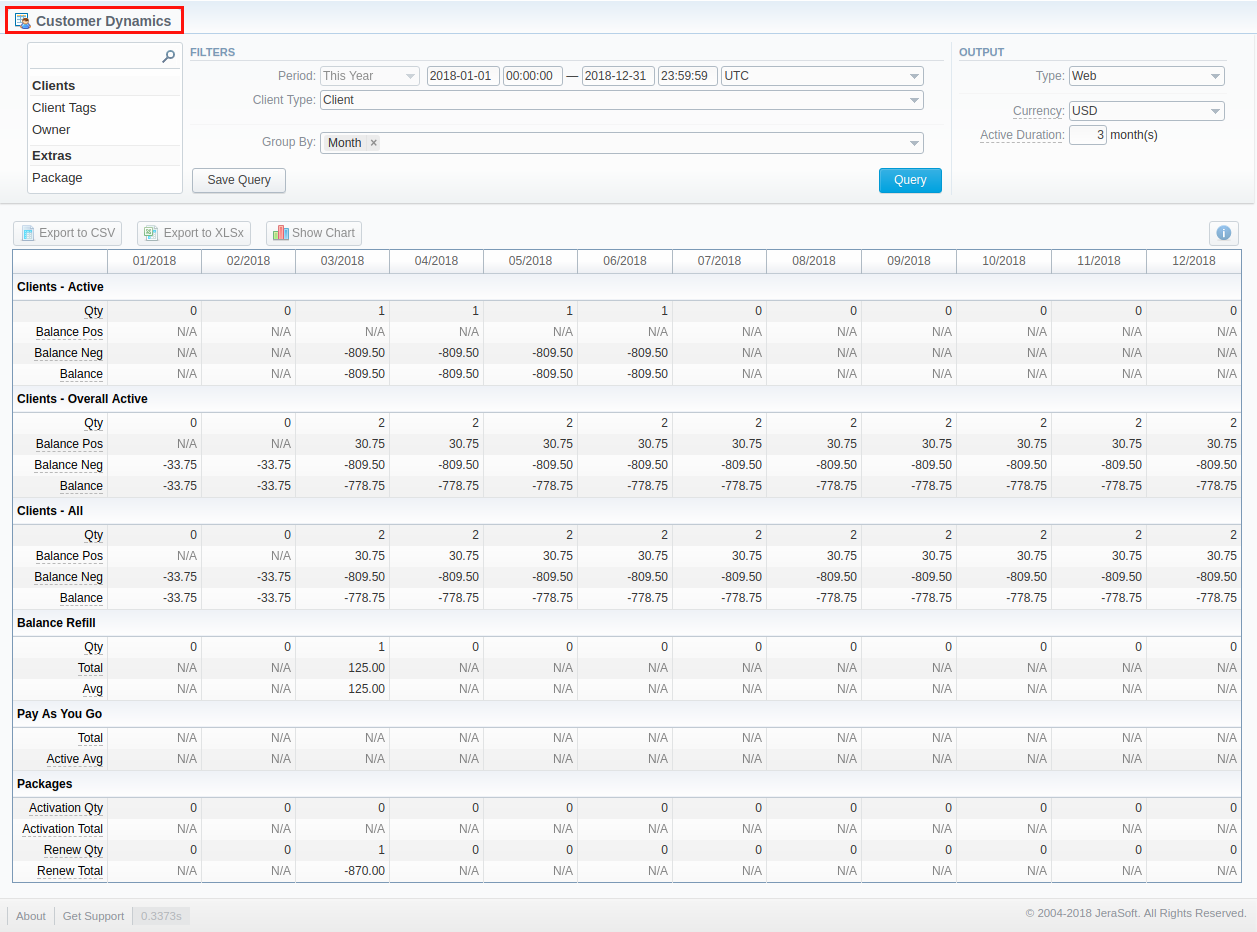
A generated Customer Dynamics report is demonstrated on a screenshot below:
Screenshot: Customer Dynamics report
| Title | Description |
|---|---|
| Clients - Active | This subdivision shows statistical data of customers that actively use services according to the period specified in the Active Duration field
|
| Clients - Overall Active | Here a statistic data of customers that actively used paid services at any time is displayed
|
| Clients - All | It presents all customers according to the filter settings
|
| Balance Refill |
|
| Pay As You Go |
|
| Packages |
|
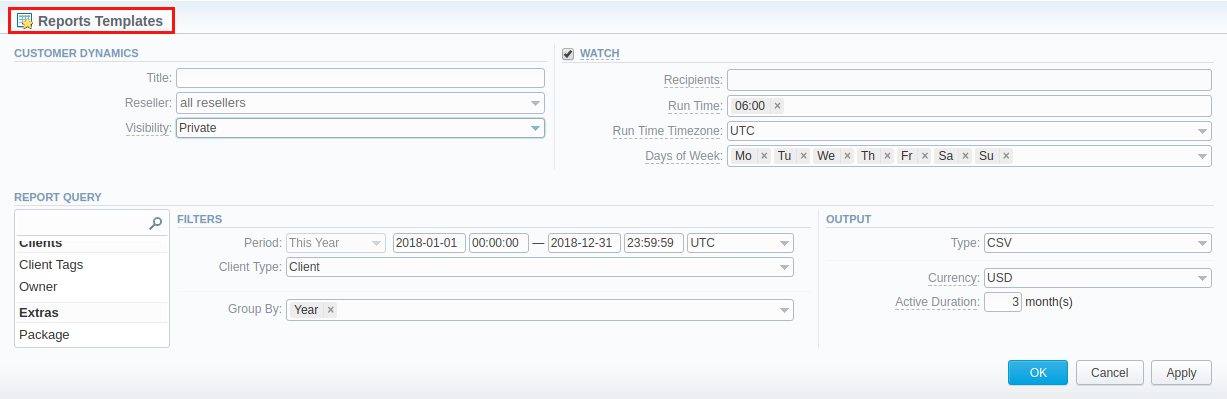
Also, you can create a template for reports and save specified parameters by clicking the Save Query button. A pop-up window with settings will appear and you need to fill in the following form:
Screenshot: New Template form
| Panel | ||||||||
|---|---|---|---|---|---|---|---|---|
| ||||||||
To find more details about templates, please refer to the Report Templates article in our User Guide. |
Customer Dynamics buttons: export, chart.
You can export data to a CSV and XLSx file, which contains only currently displayed data, with no automatic request to update data while exporting. Also, it is possible to create charts for illustrating crucial information easily:
1. To download a report in .csv, click on the Export to CSV button above the report.
2. To download a .xlsx file, click on the Export to XLSx  button above the report
3. To create a visual chart, click on the Show Chart  button above the report. There is more information available on this topic in the article How to create a statistic chart? in our Knowledge Base. From the drop-down list on this option, you can find the next pre-configured templates for the chart:
- Clients - Active: Qty
- Balance Refill: Total
- Pay as you Go: Total
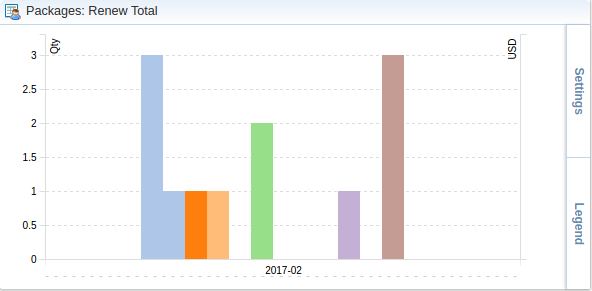
- Packages: Renew Total
- Blank Chart
Therefore, you can create a new chart or select Blank Chart to have a new empty worksheet for configuring a custom chart
4. You can check an actual date interval by clicking on the Info  icon. The displayed data could be different from the Interval specified above if there is no data for the period.
Screenshot: Customer Dynamics chart
Overview
Content Tools