...
Screenshot: System Status section
 Image Removed
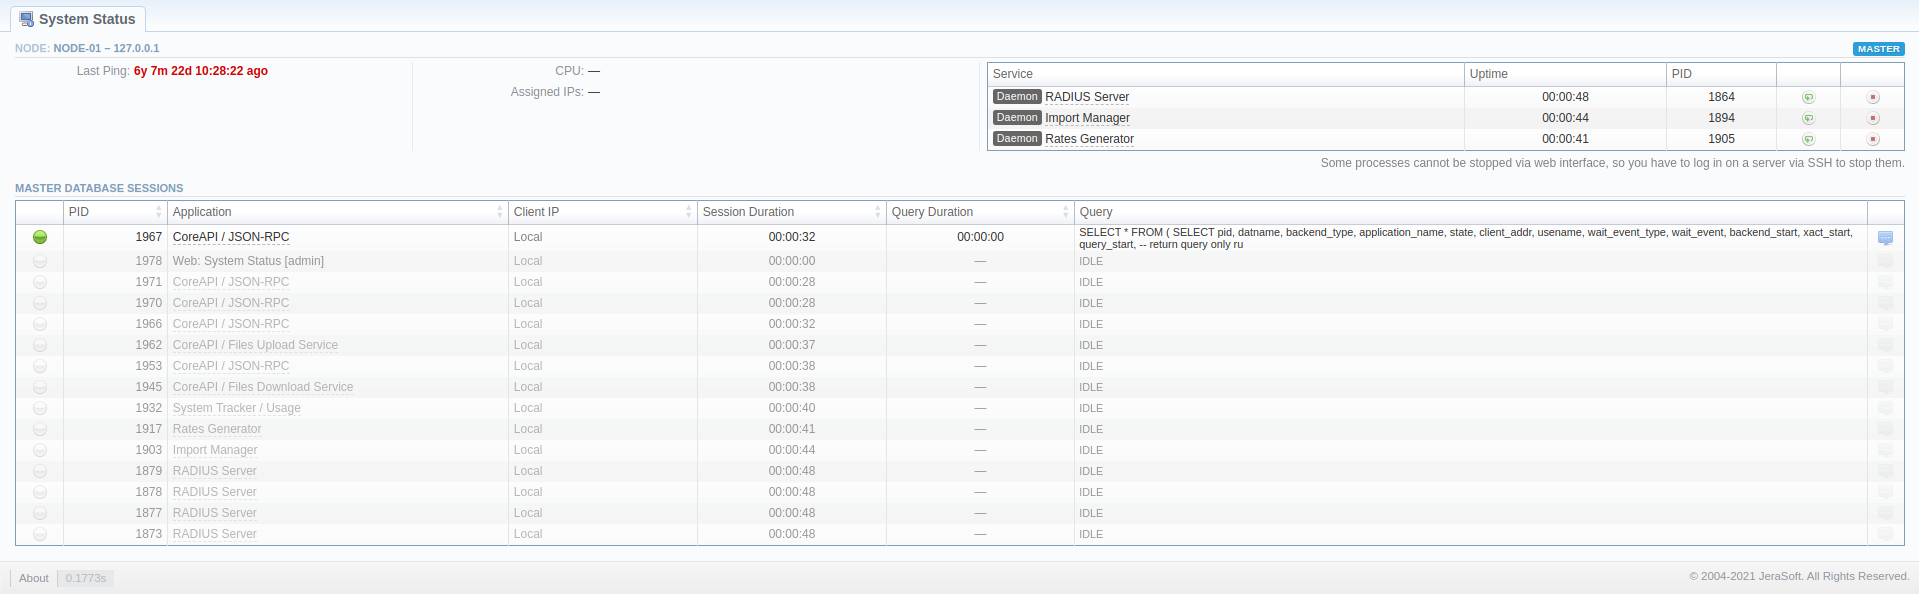 Image Added
| Information Block | Column | Description |
|---|
LocalhostNode: [node_ident]-[ip]
| CPU |
Number of Central Processing Unit coresLA | System Load Average| Load | CPU utilization within 1 min, 5 min, and 15 min periods. |
| Memory | Amount |
of Used and | Services | Number of currently running services |
ID | | with breakout for cache, shared, and available |
| Uptime | Current uptime of the system |
| Last Ping | A timestamp of how long ago we received a ping from the server |
CPU | Number of Central Processing Unit cores |
| UDP Buffers | List of UDP ports with queue size in incoming/outgoing queues |
| Assigned IPs | Current server IP(s) |
System service identification number |
| Service | Name of the system service. If the service |
Started on | | is a daemon, it will be marked accordingly. |
| Uptime | Current uptime |
Start date and time UptimeCurrent uptime | Process ID of the system service |
Master Database Sessions
|
ID
| PID | Database session process ID |
| Application | Name of the application |
| Client IP |
| Session Start | Session start date and time |
| Query Start | Query start date and time |
Duration | Session | IP of the server, accessing the Master database |
| Session Duration | Session duration |
| Query Duration | Query |
| duration |
| Query | Description of the query |
The section allows a user to start, stop, and restart services manually with the help of certain icons.
...
| Panel |
|---|
| borderColor | #ffffb3 |
|---|
| bgColor | #ffffb3 |
|---|
| borderWidth | 2px |
|---|
|
  Attention Attention
Note that you cannot stop some processes via the web interface. To do so, you need to login on a server via SSH to stop them. |
...