Docs for all releases
Page History
...
| Panel | ||||||||
|---|---|---|---|---|---|---|---|---|
| ||||||||
Please note, the system shows rounded values in the reports. But while calculating the system takes an exact value. Hence, the procedure of the rounding is the following:
|
...
- On the Filters menu, select desired parameters for the report.
- Enter the interval and specify a timezone
- Select parameters in the Group By field, for example, Currency, Origin, etc.
- Then choose Columns in the Output form, for example, Average Rate, ASR Std, ASR Cur, ACD Std, ACD Cur, Total Records, etc.
- Specify Type field or leave its default settings (Web / Grouped)
- Specify the currency and choose the code deck (if applicable).
- Press Press the Query button.
| Panel | ||||||||
|---|---|---|---|---|---|---|---|---|
| ||||||||
|
...
Also, you can create a template for reports and save specified parameters by clicking on on the Save Query button. A pop-up window with settings will appear, and you will need to fill in the following form.
Screenshot: New Template form
...
To load already existed templates while generating statistic reports click Load Query button reports, click the Load Query button in the Summary Report section.
...
You can export data to a CSV and XLSx file, which contains only currently displayed data, with no automatic request to update data while exporting. Also, it is possible to create charts for easily illustrating a crucial crucial information. And you can generate a report using the same criteria in the Orig-Term report and the xDRs list sections.
...
| Panel | ||||||||
|---|---|---|---|---|---|---|---|---|
| ||||||||
When you make a report based on two periods, two xDRs list
When you make a report and filter data by Client / Client Tags / Account / Code / Code Name / Owner parameters, two Orig-Term icons
|


...
6. You can check an actual date interval by clicking on on the Info  icon. The displayed data could be different from the Interval specified above if there is no date for the period.
...
This tool allows building a report with side-by-side sub-reports. Use it to run a comparative analysis on the same page. It's helpful for reviewing multiple parameters, totals, and compare results at different time intervals. The Compare Period option is designed to create a report that shows two sub-reports side-by-side.
To enable this option, click on the plus  sign icon next to the Period field and specify both intervals (Period 1 / Period 2) for the report.
Screenshot: Summary Report section
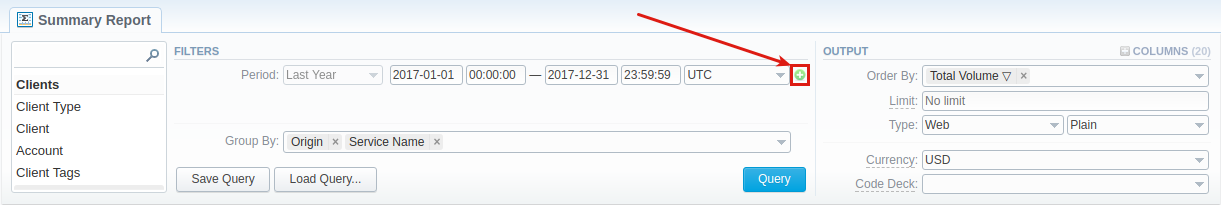
Then, choose columns for a main and comparative period in the report Output form. When all required parameters are specified, click the Query button.
...
| Panel | ||||||
|---|---|---|---|---|---|---|
| ||||||
|
Knowledge Base Articles
Content by Label showLabels false spaces +KB showSpace false sort modified reverse true cql label = "stats_summary" and space = "KB" labels +stats_summary
Overview
Content Tools