Docs for all releases
Page History
| Panel | ||
|---|---|---|
| ||
|
Active Sessions Search Form
...
| Information block | Field Description | |||||||||
|---|---|---|---|---|---|---|---|---|---|---|
| Filters | On the Filters menu, select required parameters for the report. To cancel any filter, click on the delete You can start a quick search by typing filters' names in the field at the top of drop-down menu with filters. | |||||||||
| Group By | Select a grouping option, here you can choose and swap columns, or change their order. There are following accessible options to group the data in the report:
| |||||||||
Additional Filters | ||||||||||
There are following accessible additional filters:
| ||||||||||
| Orig Client | Define an origination client for the report | |||||||||
| Orig Account | Enter an orig account for the report | |||||||||
| Orig Code | Specify an orig code for the report | |||||||||
| Orig Code Name | Indicate an orig code name | |||||||||
| Term Client | Define a termination client for the report | |||||||||
| Term Account | Enter a term account for the report | |||||||||
| Term Code | Specify a term code for the report | |||||||||
| Term Code Name | Indicate a term code name | |||||||||
| Output | This form contains settings of the report output data. Click plus | |||||||||
| Accessible columns in the report | ||||||||||
There are following columns to add in the report:
| ||||||||||
Total | Quantity of sessions in the database, total quantity. | |||||||||
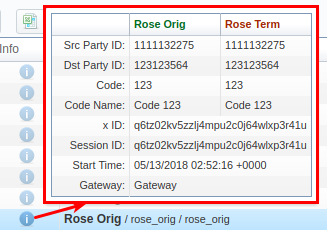
| Info | By hovering over Info
Screenshot: Info
| |||||||||
| Originator | The name of the originator, orig gateway, account IP, Name or ANI. | |||||||||
| Terminator | The name of the terminator, term gateway, account IP, Name or ANI. | |||||||||
| Src Party ID | The source number. | |||||||||
| Dst Party ID | The destination number. | |||||||||
| Duration | Session duration, specified in seconds. | |||||||||
| Other output settings | ||||||||||
| Order By | Select parameters to sort already grouped data in columns. Here you can sort data from highest to lowest values (or vice versa) and select different values. | |||||||||
| Type | Choose a format of the report from a drop-down list: Web / CSV / Excel XLS / Excel XLSx Also, select next to the Type field a look of table view:
| |||||||||
| Limit | Determine the number of rows that will be visible in the report. It is useful for displaying some top positions by chosen parameter. It is available only for Plain type of the report. | |||||||||
| Send to | You can send generated reports via email. Also, it is possible to specify several emails.
| |||||||||

Query templates
Also, you can create a template for reports and save specified parameters by clicking Save Query button in the form. A pop-up window with settings will appear and you need to fill in the form. Detailed description on creating a template can be find in Report Templates article in our User Guide.
...
4. To create a visual chart, click the Show Chart  button above the report. There is more information available on this topic in the article How to create a statistic chart? in our Knowledge Base.
| Panel | ||||||||
|---|---|---|---|---|---|---|---|---|
| ||||||||
If you want to create a proper Line chart for different clients, please follow these steps:
|
Knowledge Base Articles
Content by Label showLabels false spaces +KB showSpace false sort modified excerpt true reverse true excerptType simple cql label = "active_calls" and space = "KB" labels active_calls
...
Overview
Content Tools